- by New Deal democrat
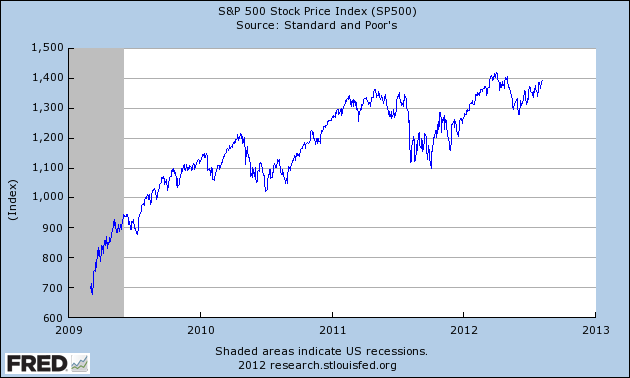
As most everyone knows, the stock market is a leading indicator for the economy. A cursory look at its growth since the March 2009 bottom shows that its advance has slowed over the last year or so, as if it were approaching the crest of a rounded hill:
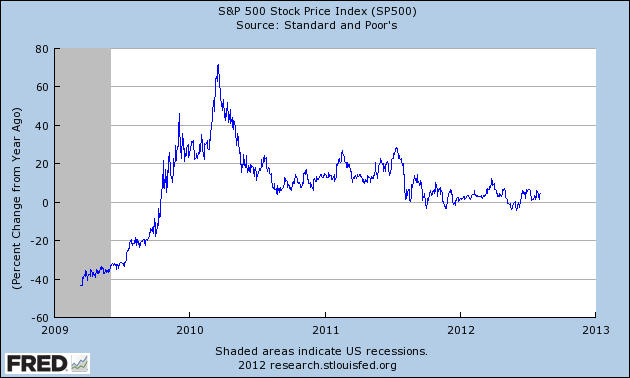
A graph of its YoY growth rate shows that indeed the rate of growth has slowed to the point where for the last year, the rate of YoY advance has meandered generally between 0% and 5%:
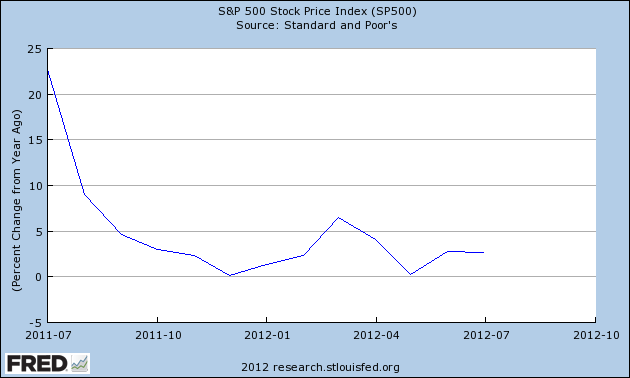
Here's a close-up focusing on the last 13 months, smoothed to its monthly average better to show the trend:
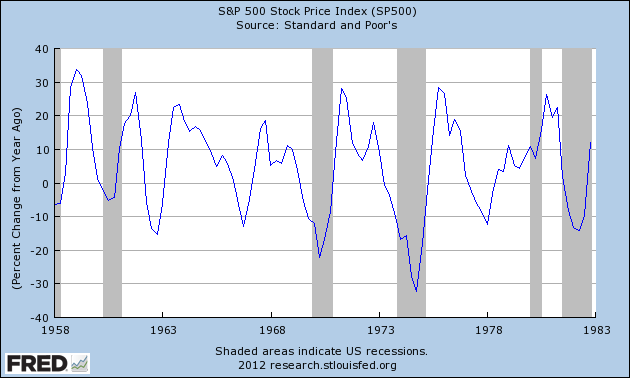
In the past, this paltry a rate of growth has been a sign of either a recession or at very least a "growth recession." Here's the YoY% change in the S&P 500 from 1958 through 1982:
And here it is from 1983 to the present:
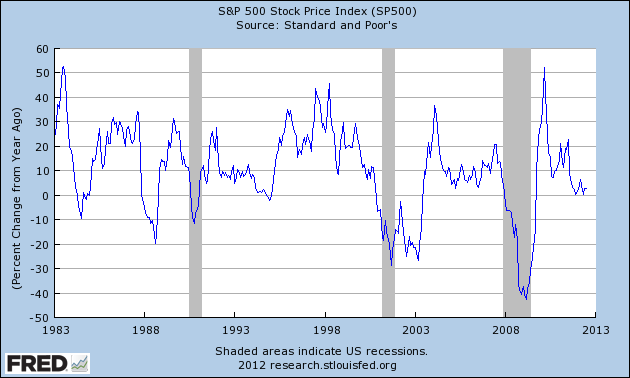
Recessions have always been accompanied by negative YoY stock market returns. Zero to 5% growth has sometimes been a harbinger of recession, but just as often - for example, 1966, 1984, 1994, and 1998 - has been associated with periods of slow growth or financial distress.
The present period of poor growth has existed for 11 months, showing that this is a more serious concern than during the 2010 "double-dip" panic.