- by New Deal democrat
The weakness that I foresaw happening during the first half of this year appears to be worsening, although I continue to believe it will be too short and too shallow to qualify as a recession.
First of all, here's an update of my scattergraph of initial jobless claims (left scale) and private monthly payroll numbers (bottom scale). The general idea is that hiring weakens first before a recession actually begins (i.e., similar jobless claims equate with slower hiring), and relative to layoffs new hiring strengthens after the worst downturn in the recession (i.e., similar jobless claims equate with more hiring). In the graph below, the pre-recession weakening in 2007 is in purple, the deepening losses in red, and the relatively better hiring for the same amount of new jobless claims beginning in April 2009 in blue. The March, April, and May 2012 disappointing jobs numbers are shown in orange:
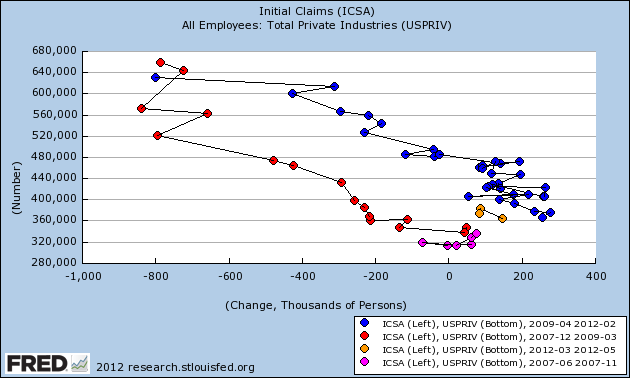
April and May's poor payrolls numbers are what I would expect to see on the cusp of, but not yet in, a new economic contraction.
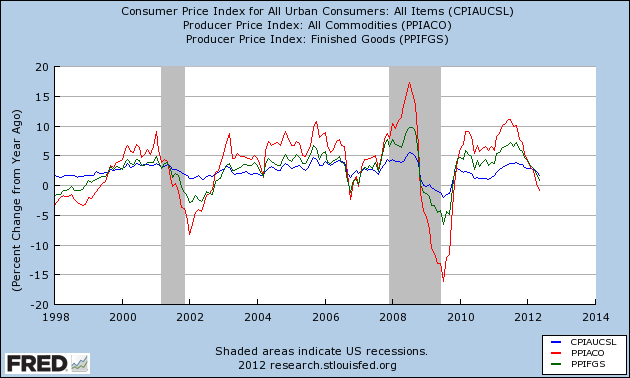
One of the other clear signs of weakness is shown by comparing YoY consumer prices (blue) vs. producer prices (green) vs. commodity prices (red). Usually before a recession there will be a rise in inflation, with the more upstream producer and commodity prices spiking higher than consumer prices. As the economy weakens into and through a recession, the more upstream prices fall more than consumer inflation, and their bottom marks the end of the recession. Here's a graph showing that pattern for both the 2001 and 2008-09 recessions, as well as the weakness in 2006 (in which one quarter of GDP was just barely positive, and we had one month of job losses plus two of tiny gains:
Another way to give you a better look is to subtract YoY consumer prices from producer prices (blue in the next two graphs). A negative result shows weakness, a positive result shows strength. Then we compare with monthly job gains or losses (red). First, here's 1998 through 2003:
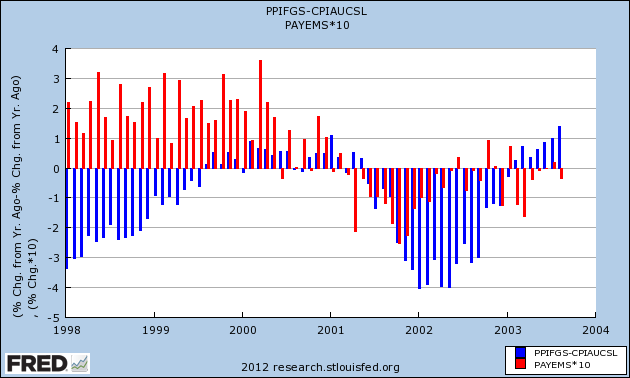
Notice that we started to have job losses a few months before the YoY inflation metric turned negative.
Now here is the period of 2006 to the present:
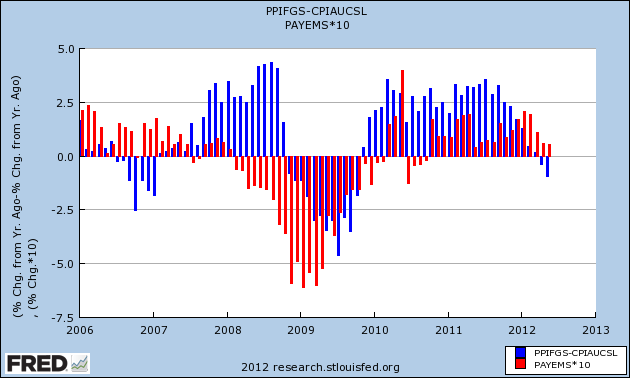
In 2006 YoY price weakness did not result in actual job losses, except for one small loss in one month. In contrast notice the severe job losses in 2008 even before we went into YoY deflation. This year, as in 2006, job gains have remained positive even in the face of YoY price weakness.
I anticipate further declines in YoY inflation readings, as the June - August 2011 CPI numbers of +.1%, +.3%, and +.3% are replaced, and hence further economic weakness. After that the 2011 monthly readings were essentially 0, so I expect the relative weakness to end.
Right now YoY consumer prices are up +1.7%, producer prices are up +0.7% YoY, and commodiaty prices are actually negative YoY. At this point in the cycle in both 2001 and 2008 there were job losses. Like 2006, so far we have escaped actual job losses.
Additionally, although I won't show the graph, real retail sales were positive by +0.1% in May, but only because there was more price deflation than lower consumption. With April's downward revision, we are still below March's number. This, along with payrolls, is one of the four coincident markers of recession.
This morning, industrial production, the third of the four coincident markers of expansion vs. contraction, also showed a -0.1% contraction. This gives us pathetically positive payrolls and sales, with sales slightly under their recent peak, and a slight decline in production (albeit last month production grew a full 1.0%, so this is just one soft month). This is an economy in danger of a complete if temporary stall.
Despite that, with the long leading indicators showing more housing starts, more money supply, and more refinancing at lower interest rates, I do not expect the weakness to last into the autumn. But from now through summer, we may have several months of actual job losses until we reach the point where deflation bottoms out, and low gas prices fuel renewed growth. The continuing decline in inflation will also mean that real wage growth will resume weakly.
In summary, I expect this summer not to be quite so bad as 2001 in which we had two non-consecutive quarters of negative GDP and a 600,000 decline in non-manufacturing payrolls much exacerbated by the September 2001 terrorist attacks, but worse than 2006.