
- by New Deal democrat
As bad as the chronic unemployment situation is, as I said a month ago, the stagnation in wages worries me even more. We just barely escaped outright wage deflation in the 2008-09 recession. Now 3 years after the bottom of that recession, we have added on less than half of the jobs lost.
As a result of the huge slack in the labor economy, wage growth has continued to slow or even go into outright decline, depending on how you measure it. It is difficult to imagine how we can escape an even worse disaster if another recession hits while this is still the case.
First of all, here is a graph showing YoY growth in average wages for non-supervisory employees. Note that this measures the mean increase rather than the median. You may recall that when we measure by median wages (which unfortunately are only updated quarterly) and by quintiles, the situation is even worse:
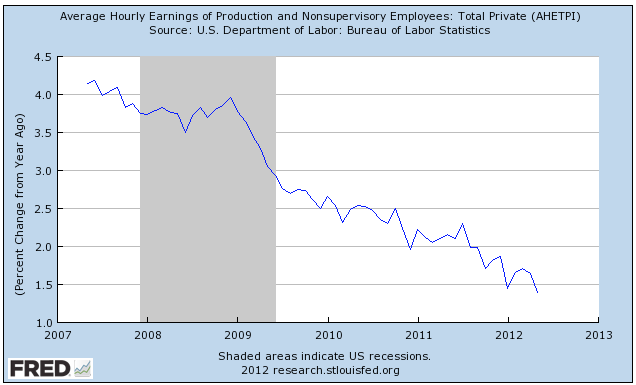
Note that measured on a YoY basis, wage growth is declining by about 1/2 percent a year. It took about 4 years for average wage growth to decline from 4% to 2%. We're now at about 1.5% meaning if the trend continues, in about 3 years wages will be completely stagnant on average.
And that's before we take inflation into account.
Here are real wages adjusting for inflation for the last 5 years. The effect of the price of oil plummeting at the end of 2008 was to increase real wages. Since that time the oil choke collar has tightened the noose again:
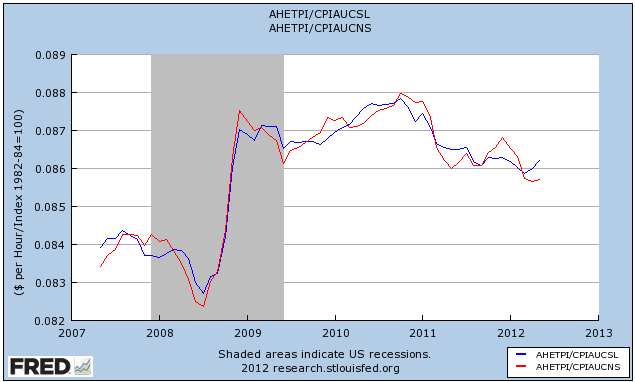
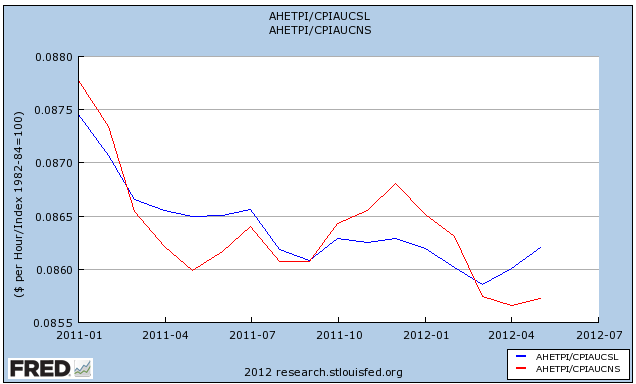
In the graph above I've measured the CPI in both seasonally adjusted (blue) and non-seasonally adjusted terms (red). When you pull into a gas station you aren't offered the "seasonally adjusted price of gas," you pay the price on the pump. Thus in measuring the effect of the Oil choke collar on the average American's finances, the non-seasonally adjusted CPI is probably the better measure. Note that by so doing, we can see big downdrafts in real wages in early 2011 and to a lesser extent in early 2012, with an intervening increase during the second half of 2011, as shown when we zoom in on 2011-12:
This dynamic goes a long way towards explaining why we are seeing stalls in economic growth in the first half of the last 3 years, and re-acceleration in the second half, and why the second half of 2010 had the highest quarterly GDP since the recession bottomed.
Depending on how you measure, in the above graph it looks like real wages may have made a short term bottom in March or April. As a result, measured YoY real wages may turn positive as soon as July:
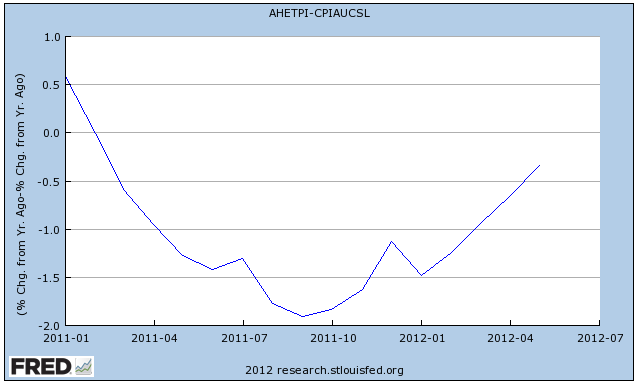
That plus the sharp increase in refinancing ought to translate into more consumer spending, and it is spending that leads jobs, not the other way around. Indeed, the more the rest of the world falters, the more inflation in the US will ease, and American families will get a respite from real declining wages.
But only for a limited time. The ligatures are tightening, we have only a short time left, and it ought to be setting off a general alarm in Washington -- but alas official Washington is too busy summoning Jamie Dimon so that they can compete to tongue-wash his shoes.