
Today, let's start with the Brazilian market, which has been dropping since the beginning of March. In fact, this market has dropped over 25%, placing it squarely in the bear market camp. The underlying technicals are also bearish; prices are below the 200 day EMA, all the shorter EMAs are moving lower, the MACD and CMF are dropping and we see a pick-up in volatility.

The weekly Brazilian chart shows that prices are near three year lows.
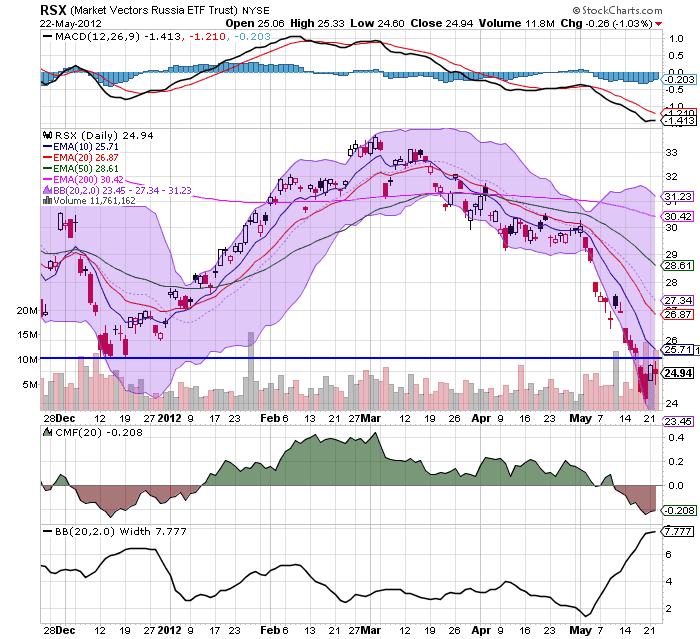
The daily chart of the Russian market is very similar to the Brazilian market; overall it's another developing market that has an extremely bearish chart.

The Indian market has been dropping since the end of February. Prices rose above the 200 day EMA, but have since moved lower. However, prices are still slightly above lows established at the end of last year. But this does not offer much solace, as the Indian economy is slowing and the political system is caught in a terrible cycle of dysfunction.

The weekly chart of the Indian market shows that prices are right at technical support levels -- and near three year lows.

The Chinese market has fared a little better, largely because of its attempted rally from mid-April to early May. But prices found resistance near the 200 day EMA level and have been moving sharply lower for the entire month. Again, note the bearishness of the overall technicals -- a dropping MACD, negative CMF and rising volatility.
The picture painted by the charts of all the developing markets is one of a deteriorating situation. In fact, the charts tell us that things could get downright ugly.