Thursday, April 12, 2012
Morning Market Analysis: BRIC Correction and Commodity Weakness
After hitting the 110 price level in late February, oil has slowed moved lower. It has moved through technical support at the 103.5 level and is now below the 50 day EMA. The 10 and 20 day EMA are both moving lower and the 10 day EMA has crossed below the 50. While the MACD and the CMF are both declining, we're not seeing a lot of movement on the A/D line.
The sell-off has been incredibly gentle -- especially considering the market is worried about global growth. However, the slow and gradual technical deterioration -- especially as we get closer and closer to the summer driving season -- is very interesting.
The industrial metals ETF is at the 61.8% Fib level. The shorter EMAs are all moving lower, and we see a bearish alignment (shorter below longer). The MACD is declining as well. The CMF is nearing 0, but the A/D is not super bearish. But the big issue is that prices are below the 200 day EMA -- a bear market. That does not bode well for the global economy.
UPDATE: I forgot to add this to the original post. Cattle prices broke an uptrend that started in Mid-December and went to the end of March. Since then, prices have continued to move lower, breaking support in the 29.75, 29.10 and 29 price level. Also note the declining EMAs, MACD and volume indicators. However, the MACD may be close to giving a buy signal. However, my guess is that would turn into a technical rebound into an EMA or Fib level.
The above three commodity charts are bearish; they do not give us encouragement regarding the macro situation in the near term.
The Chinese market ETF is in a downward sloping pennant pattern, below the 200 day EMA. We also see declining shorter EMAs. The MACD is trying to turn bullish, and the A/D line is still bullish. But, the real issue is prices are below the 200 day EMA. Prices have moved from the 30.5 area to 36 -- a decline of a little over 10.5%.
The Russian market is in the exact same situation as the Chinese market -- a declining wedge with prices now below the 200 day EMA. Here we see a decline of about 11% -- from 33.5 to 29.79.
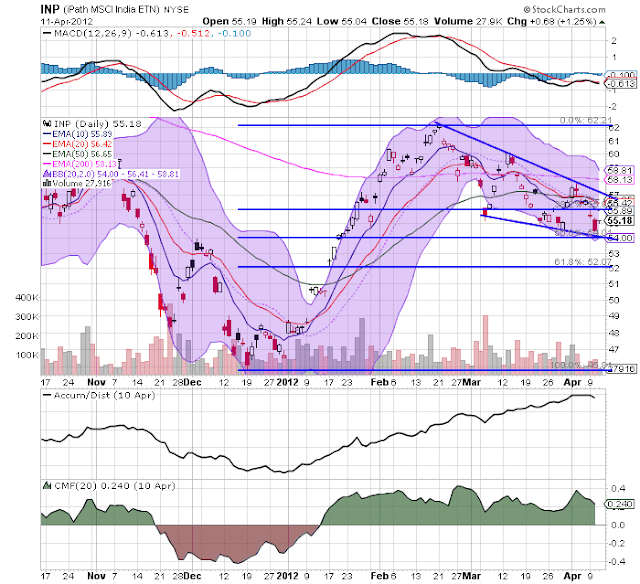
After hitting a high of 62 in mid-February, prices in the Indian market have moved lower to 55.18 -- a decline of 11%. Prices are below the 200 day EMA, momentum is negative (although the direction is neutral), but the volume indicators are positive.
The Brazil ETF has dropped from 70 to 61.83 -- a drop of nearly 12%. The shorter EMAs are moving lower and prices are below the 200 day EMA. Momentum is declining as well.
The BRIC charts are all down at least 10%. That's a big move lower and indicates all is not well with the emerging world.


