Monday, January 30, 2012
Morning Market: Is The Rally Over?
The 60 minute chart shows that prices moved sideways last week, using 131 as support. However, the overall uptrend is still intact
The 30 minute chart shows last week's price action in more detail. Monday and Tuesday were technically meaningless. On Wednesday, we see the rally inspired by the Fed's minutes, but that was completely erased by the end of trading on Thursday. Friday we see a saucer formation that never really materialized.
The weekly chart tells the real story: after consolidating in a symmetrical triangle pattern at the end of last years, prices broke higher. However, last week prices printed a spinning top candle pattern, which is considered a sign of a halt to the rally.
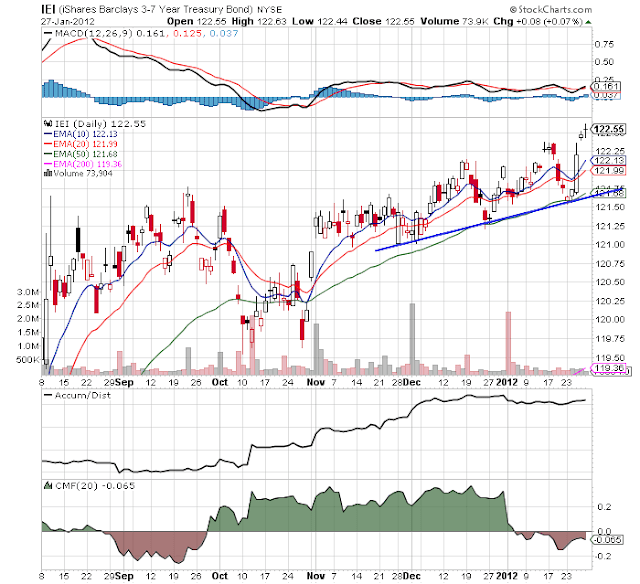
The treasury market, on the other hand, had a good week, as prices caught a bid. Notice how the entire curve rallied last week, bouncing off of technical support. By publicly stating that they were not going to raise rates until 2014, the Fed told the market the current crop of treasury bonds was as good as it was going to get from a yield perspective for quite sometime, thereby making current issues that must more valuable.
So we have a sideways equity market and a rallying treasury market. That means we're seeing some stalling in the overall risk-on move of the preceding weeks. Some of this is technical; market don't rally forever. In addition, on the shorter charts, we didn't see a big move lower; merely a consolidation sideways. However, we do want too keep our eye on support levels going forward.
Industrial metals are still in a strong rally. Prices have moved through important resistance levels, and the now the shorter EMAs are moving lower. We also see the MACD, A/D and CMF point to continued rallying. Some of this rally is caused by a weakened dollar, but that doesn't account for the entire rally.
The dollar has been dropping for the last few weeks. After consolidating sideways in mid-January, prices have been consistently moving lower. Part of this is the result of a strengthened euro, which was in turn caused by the EU appearing to be closer to solving their problems. The more recent move lower, however, was caused by the Fed keeping rates low for a few years.
The dollar's daily chart is now very bearish; the momentum and volume indicators are all moving lower and prices have moved through support.
What's important here is the fundamental reason for the sell-off. First, we have money moving back into the euro at the expense of the dollar. In addition, the Fed has stated they will be very accommodating for several years. The first scenario is positive for the US economy, assuming the momentum continues. The second is also positive, as lower rates should increase borrowing.
Overall, it appears the markers are pausing -- at least so far. A big reason for my thought there is the underlying market situation: last week, the following was the order of top five best performing sectors: basic materials, consumer discretionary, industrials, technology and utilities. Four of those five are riskier market sectors, and utilities probably rose because of an expectation of long-term low interest rates which makes high yielding utility stocks attractive. In addition I also think the rally in industrial metals is telling.
But, like all pauses, it's important to keep an eye open to all possibilities.


