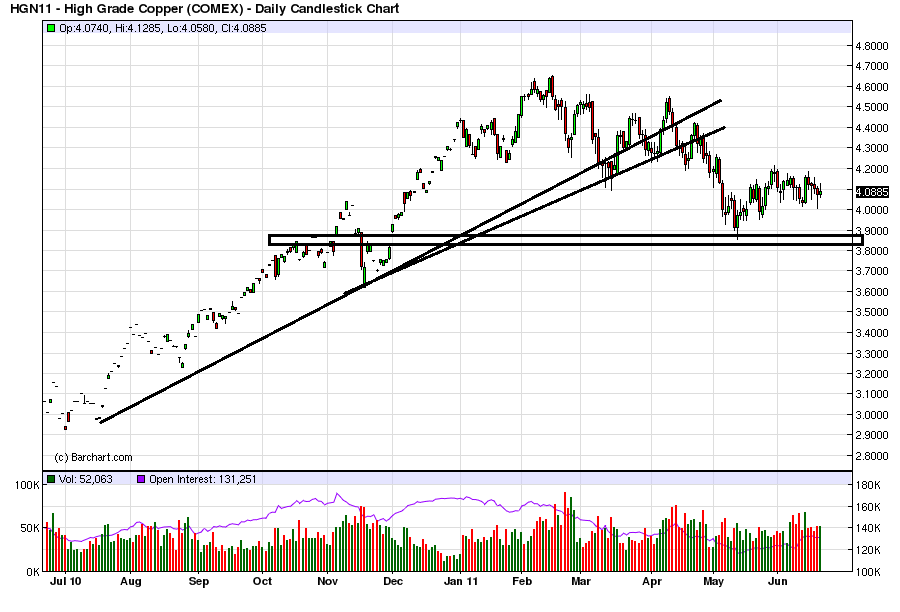
 The primary point made by the one year chart is prices have broken a long-term uptrend. However, also note that from a long-term perspective prices have not dropped as sharply as anticipated given the overall weakness of the current economic numbers.
On the shorter chart, prices have continued to move in a down, up, down pattern. Notice the disciplined manner of the sell-off; prices have not collapsed in a massive sell-off, but have instead moved in a disciplined move lower. For the last several weeks, prices have moved sideways. Also note the 10 and 20 day EMA are now moving sideways, and both EMAs are entwined with the other. The MACD indicates momentum is fair. There chart says traders are in a wait and see mode.
Overall, this is really not a bad chart. Although China and India are raising rates, Japan is just starting to dig out from the earthquake and US manufacturing is slowing down, prices are still only down about 12%. Given the macro backdrop, the lack of a price collapse is very good news.