
Let's start with a few macro observations. First, the market has been bouncing between two Fibonacci levels this year. Corey over at Afraid to Trade pointed this out a little bit ago, but it bears repeating.

Second, notice we either have a failed head and shoulders pattern or a complex head and shoulders pattern developing. Third, the 104-106 area is providing incredibly important technical support for the market this year. Right now prices are a little under 2% over 106 right now, so we're approaching important technical support levels.


While I've noted the rise in the Treasury market, above is a chart of the junk bond and investment grade bond ETFs. Notice that both are rallying along with the Treasury market. Ideally, the investment grade bond should rise more or less with the Treasuries; the investment grade bond is a good credit risk, although with a bit more risk than the Treasuries. But if the Treasury market is signaling a slowing economy, the junk bond ETF should be falling, as a slowing economy would increase the risk of poor credits.

Last week, the SPYs moved through important resistance on Wednesday (a) with a gap lower (b). They continued lower on Wednesday morning, then moved slightly lower Wednesday afternoon. On Thursday morning, prices gapped lower again, but then rose and spent the rest of the week in a consolidation pattern (d).
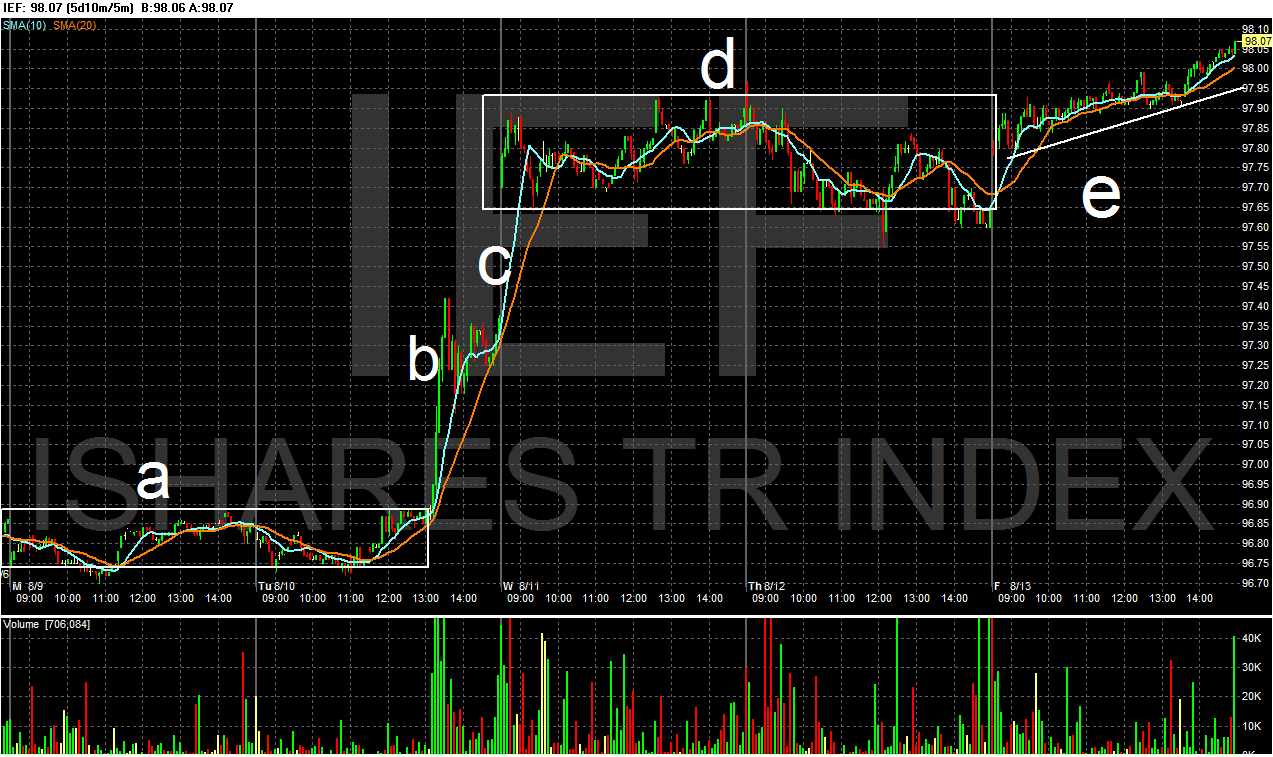
In contrast to the stock market, the IEFs (the 7-10 years Treasury market) had a good week. Prices consolidated at the beginning of the week (a) and then rallied on the Fed's announcement to move into quantitative easing (b). Prices then gapped higher on Wednesday (c), consolidated for the next day and half (d) and then had a slight upward move on Friday (e).

Finally, notice the dollar has reversed. Prices have moved through downside resistance (a), money has moved into the security (b and c) and momentum has given a buy sign (d).