However, several events have either culminated or occurred in the last few weeks that raise yellow flags regarding the US' economic expansion. This does not mean the sky is falling or that Armageddon is approaching. But it does mean this is a good time to look at exactly what has happened and determine the net possible negative effects on the current US expansion.
You can click on any chart to get a larger chart in a new window.
Initial Unemployment Claims
From Bloomberg:
In a setback for the May payroll outlook, initial jobless claims jumped 25,000 in the May 15 week to 471,000. The disappointment includes a 2,000 upward revision to the prior week. There are no special factors to explain the latest week's jump. The 471,000 level is the highest in five weeks, the second highest since February, and 12,000 higher vs. mid-April. But in an important offset, the four-week average of 453,500 does show improvement from mid-April's 461,000.
Here is a chart of the data:

Notice there are two trends in the data. The first is a consistent downward sloping move that started at the beginning of last summer. During this time, the weekly numbers decreased from the 600,000-650,000 range to the 450,000-500,000 range. However, since the beginning of the year this number has stayed stubbornly in the 450,000-500,000 range. Here is a chart of initial claims going back to the late 1960s:

Notice that 400,000 and below is the "normal" rate for initial unemployment claims during an expansion (at least it has been during the last four expansions).
Last week's increase to 471,000 is troubling for two reasons. First, the number has been moving sideways since the beginning of the year, indicating the improvement in initial claims has stalled. Secondly, last week we saw a sizable increase in initial claims. Had the increase been a smaller number it would not have registered. But the size of the increase in combination with the length of time this number has been moving sideways raises a yellow flag.
Let me add one caveat to this concern:

Since the beginning of the year, total establishment jobs have increased 559,000. This occurred during the same time the initial unemployment claims started to move sideways between 450,000-500,000. This indicates there may be a disconnect between initial claims and establishment job growth.
The Euro
Let's start with a chart of the euro's overall value:

The euro has moved from 151.44 near the end of last year to a close of 125.64 on Friday, a drop of 17% in about 5-6 months. That's a pretty severe drop in a fairly short period of time that indicates a loss of faith on the part of investors in the euro area. Also note that prices are at important technical levels established at the end of 2008 and again in early 2009.
The drop in the euro alone leads to increased caution. But, there are important inter-relationships between various financial markets. One of these is the relationship between the dollar and the euro. Here is a three year chart of the FXE and UUP that highlights the inverse relationship between the euro and the dollar:

Below is a chart of the UUP -- the bullish dollar ETF which shows how the dollar has appreciated in value over the last six months.

As the dollar has increased in value, we've seen a corresponding decrease in commodity prices. Adding to the downward pressure is news from China that the People's Bank of China is increasing reserve requirements to slow their economy down. Because China is one of the largest consumers of commodities, we've seen additional downward pressure on all major commodity groups.
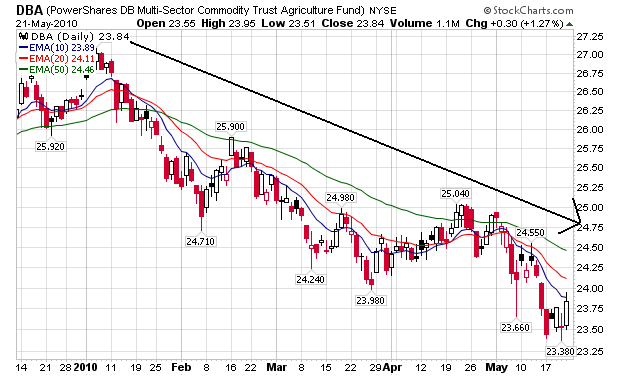
Agricultural commodities have been decreasing for the last six months; they are in a clear downward price channel.

Industrial metals have dropped over the last few weeks, partly in reaction to China and partly in response to an increasing dollar.
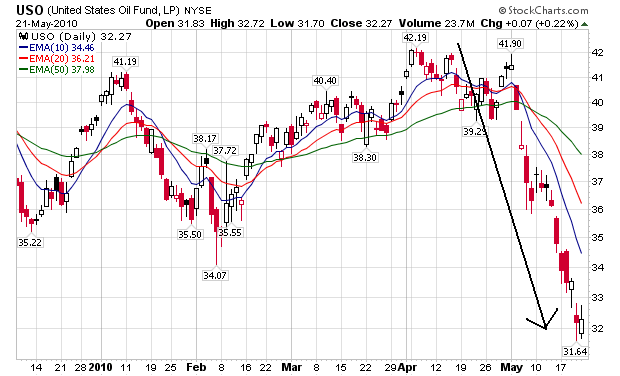
Oil has also dropped hard and is at its lowest point in the last six months. This is before the summer driving season, which usually adds an upward bid to oil prices.
Decreasing commodity prices are adding to deflationary issues, which were discussed in more detail here.
And finally, as a result of the euro's drop and the overall situation in Europe, we've seen an increase in one and three month libor, indicating increased caution on the part of lenders to make short-term loans:

One month Libor is near yearly highs.

Three month Libor is climbing
So, the central issue is a decreasing euro, which has led to an increasing dollar, which in turn has led to decreasing commodity prices. Recent reserve tightening issues in China have added downward pressure to commodity prices, which adds further evidence to the argument the US is facing an increased possibility of deflation.
Leading Indicators
Economic indicators fall into one of three categories: leading, coincident and lagging. The leading indicators rise/fall before the general economy, the coincident indicators increase/decrease with the general economy and the lagging indicators increase/decrease after the general economy. The conference Board has taken the leading indicators and made a "leading indicator index" which it publishes every month.
From the Conference Board:
The Conference Board Leading Economic Index®(LEI) for the U.S. declined 0.1 percent in April, following a 1.3 percent gain in March, and a 0.4 percent rise in February.
Says Ken Goldstein, economist at The Conference Board: "These latest results suggest a recovery that will continue through the summer, although it could lose a little steam. The U.S. LEI declined slightly for the first time in more than a year, and its six-month growth rate has moderated since December. Meanwhile, the coincident index, a measure of current economic activity, has been improving since mid-2009."
Here's the chart:
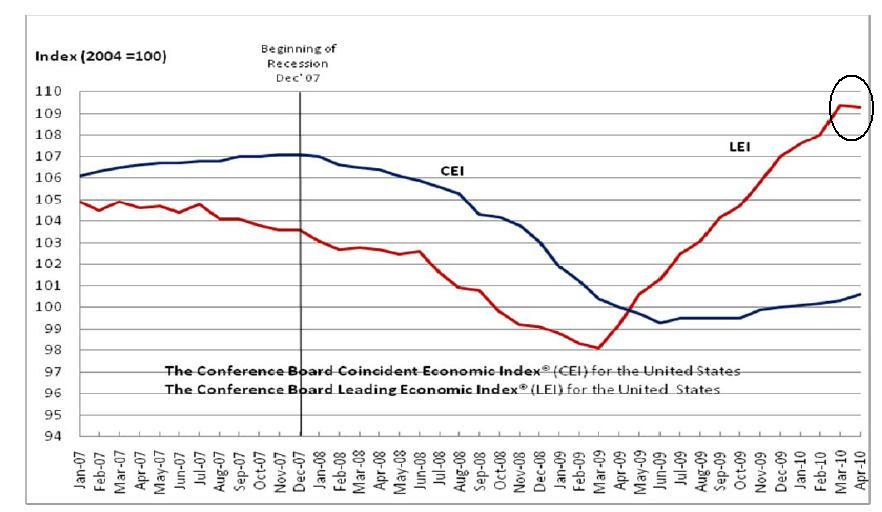
Notice the chart has increased for the better part of a year, making this one month a "blip". However, this is a very good indicator with a good track record that can't be ignored. Here's the data for why the index dropped:

Manufacturer's new orders and supplier deliveries dropped. This is hits the manufacturing sector which has been a big part of the turnaround. Coordinate this data with the drop in the Empire State index (which dropped but is still positive) and a possible slowdown may be in the works (although today's Philly Fed was positive). Building permits are way down, impacting housing, construction employment and construction/home improvement retail (Home Depot, Lowe's etc.). Home retailers had reported some good numbers recently. Money supply dropped which hits everyone. Consumer expectations dropped, hitting retail sales.
So, we have one month of a drop, but the underlying reasons for the drop are pretty broad based. This, in conjunction with the rise in initial unemployment claims, raises a yellow flag until we get more data.
Conclusion
As a result of the increase in initial unemployment claims, the decrease in the euro and the decrease in the index of leading economic indicators, caution is warranted going forward. To eliminate this caution, we need to see the following:
1.) A decrease in initial unemployment claims below the 450,000 level. In addition, the economy needs to keep up its current pace of job creation. Last month we had a great employment report. That needs to be repeated in the next report.
2.) The euro needs to stabilize. The European Union has proposed a massive $1 trillion dollar package, which was announced several weeks ago. However, the euro has continued to drop since that announcement. Markets are now concerned that austerity programs will hurt overall economic growth.
A close look at the FXE indicates the euro may be in the middle of a selling climax. But the only way to make this determination is in hindsight.
3.) Commodity prices need to rebound. An across the board drop in commodity prices indicates the markets think decreased demand is an issue going forward. An increase in commodity prices will indicate demand is picking up.
4.) The decrease in the LEIs is not fatal and probably indicates the US will be seeing a decreased rate of growth in the second half of the year.
There are two extremely positive developments from this chain of events for the US economy.
1.) Cheaper oil. Oil prices are one of the biggest threats to US recovery. At current levels, they are hardly a threat.
2.) Lower interest rates. As money has made a "flight" to quality, we've seen a rally in Treasury Bonds which has lowered yields.
Overall, these developments indicate the rate of expansion in the US will probably slow over the next 3-6 months.