Since today is a dead economic news day, and since Bonddad and Invictus have weighed in on the linchpins for their current economic views (Bonddad noticed right track/wrong track numbers getting better, Invictus notes headwinds facing the average wage-earner/consumer), I thought I would add my own post simply stating why I am bullish on the economy.
As an initial point, though, I want to say that my viewpoint is not really much different from that of Invictus. Whether or not there is a "Recovery" really just hinges on two quarters of GDP growth, which I think will be satisfied by Q3 and Q4 2009. Like Invictus, however, I am extremely concerned by the headwinds faced by ordinary American working families. I have written several times this year how there cannot be "sustained" growth without the participation of the average consumer, and a consumer constrained by debt payments and miserly wage increases in not going to give us that sustained growth. It boils down to how long there can be substantial growth without broad participation. I suspect, to paraphrase Bonddad, it will proceed in "fits and starts" until the situation changes.
After the economy fell off a cliff last fall, the next question was, how deep is the abyss. And sure enough, things kept falling and falling and hey, wait a minute! Retail sales just rose in January! That was when I first suspected that the bottom of the cliff might not be too far off, and I wrote about it near the end of February.
But I also wrote a series looking at economic indicators of the Roaring Twenties and Great Depression, and that convinced me that if the Fed and the new Administration didn't screw up, the rate of deflation might bottom in or about July, and in the face of a positively sloped yield curve, that would signal the end of the "Great Recession." That is indeed what has happened.
OK, now to the K.I.S.S. part. Way back when I first started to be involved as an individual investor, I realized that there was no way the individual could compete with the resources available to the Big Boyz. What I wanted to do, was focus on a few measures that would take me no more than 1/2 hour a week and give me 80% of the information that the Big Boyz had. Very soon, among a few other things, I was led to the yield curve in the bond market, and the CPI and PPI, as predictors of the stock market, but also the broader economy.
In periods of inflation, the yield curve in the bond market has an almost flawless record -- since WW2, the only time it was incorrect was when the yield curve inverted in the mid to late 1960s. Aside from that, whenever the yield curve was positive, then 1 year later the economy was growing. Whenever it was inverted, one year later the economy was in recession. (Later Doug Kasriel of Northern Securities added the parameter of real M1 growth, and that made it an absolutely perfect record).
Last year blogger Theroxylandr posted a graph from Ned Davis research showing one very important exception -- the yield curve was positive throughout the entire 1930s, even during most of the "Great Contraction" from 1930-32. That was a potent wake-up all to examine how the yield curve performed in times of deflation, and hence my subsequent series on Economic Indicators during the Roaring Twenties and Great Depression. That series yielded two vital insights:
1. A positive bond yield curve does portend economic growth in a deflationary scenario, provided the deflation is easing, i.e., price changes are rising towards inflation.
2. An inverted yield curve in the presence of even 3 months of deflation is the Death Signal. In the last 90 years, it has only occurred twice. The first time was in 1928. The second time was in early 2007.
With those provisos, a positively sloped yield curve has pefectly predicted conditions over the next year for the last 90 years.
Always.
Every.Single.Time.
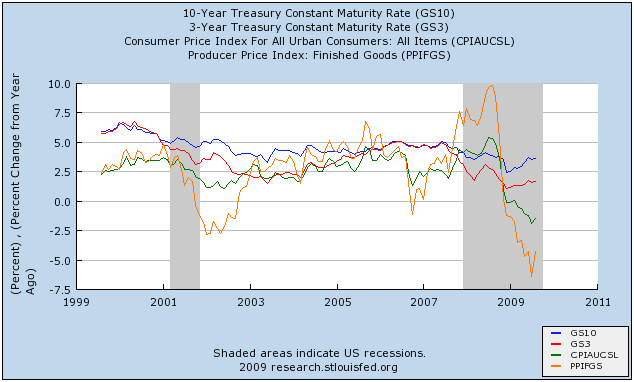
So, where do the yield curve and inflation stand now? Here's the graph:

The first thing to notice is that the yield curve is wildly positive. 3 month rates are still close to zero (red line), while the 10 year bond is between 3-4% (blue line). This is a portent of potent growth ahead for the next 12 months, provided we don't relapse into further deflation.
The second thing to notice is the relationship of CPI and PPI. Before recessions, both tend to rise, and PPI tends to exceed CPI. As recessions wear on, the relationship reverses, with both declining, PPI moreso than CPI. At the bottom (in deflationary busts), or shortly thereafter (in inflationary recessions), both start to increase, but YoY PPI is still well below YoY CPI. That's where we are now.
Barring speculators and/or the Chinese government thinking that somehow $100+ Oil is a neat thing, which seems pretty unlikely; or wages being actually cut (which is a possibility, but I suspect the threat is easing), we are in for a period of substantial GDP growth between now and next summer.