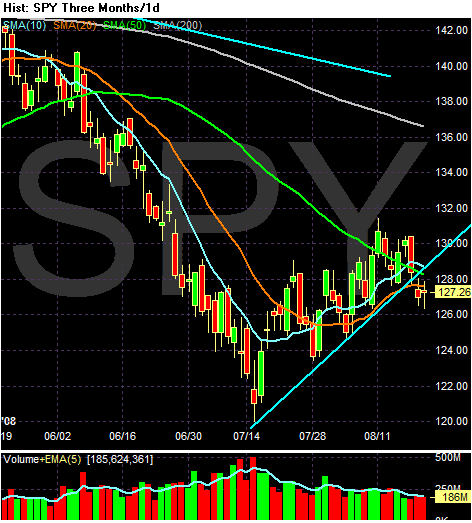
On this chart, notice the following:
-- Prices are below all the SMAs
-- Prices are below the trend line that started in early July
-- The long-term SMAs (50 and 200) are both heading lower
-- The 10 day SMA has moved neutral
-- Prices are still below the 200 day SMA
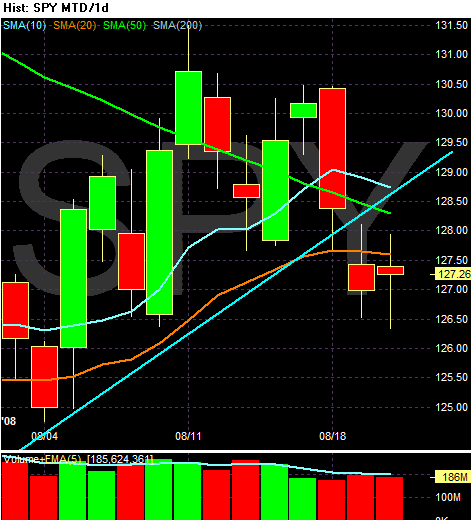
Now -- let's look at the 1-month chart

Specifically notice the last two days. Note that prices have gotten over the 10 day SMA, but have not closed above that level. In addition note the lack of movement as indicated by the candles with small bodies. Traders are still trying to figure out where they want to go.