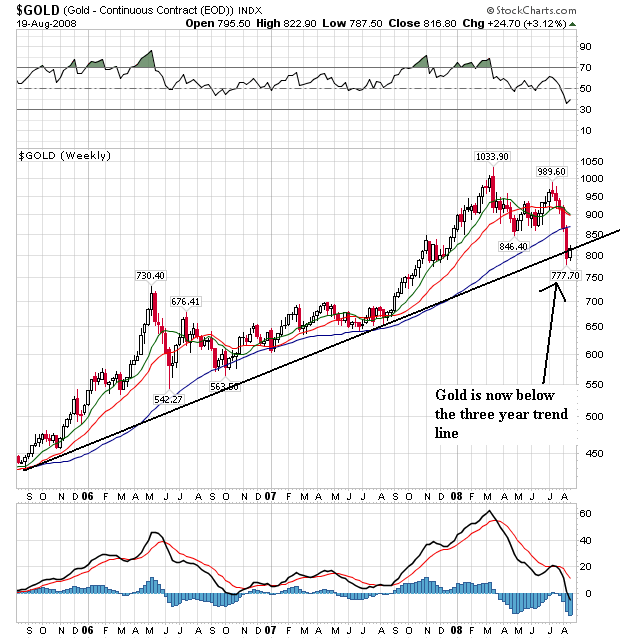
This is big news. The gold market has been rallying for the last three years. However, we now see that gold has broken below the three year trend line. This signals a reversal of trend. Also note this is the most liberal trend line available -- the trend line that connects the lowest lows of the last three years. Using a trend line that connects more of the bottoms yields this result:
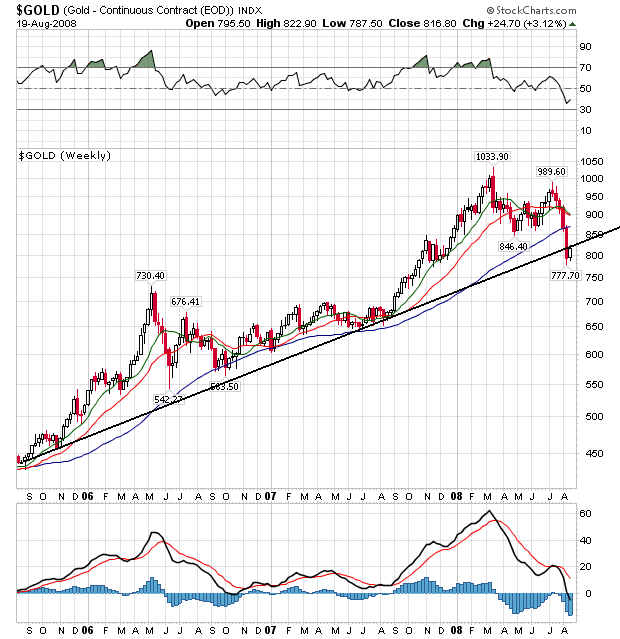
In other words, no matter how you slice it, the trend has been changed.
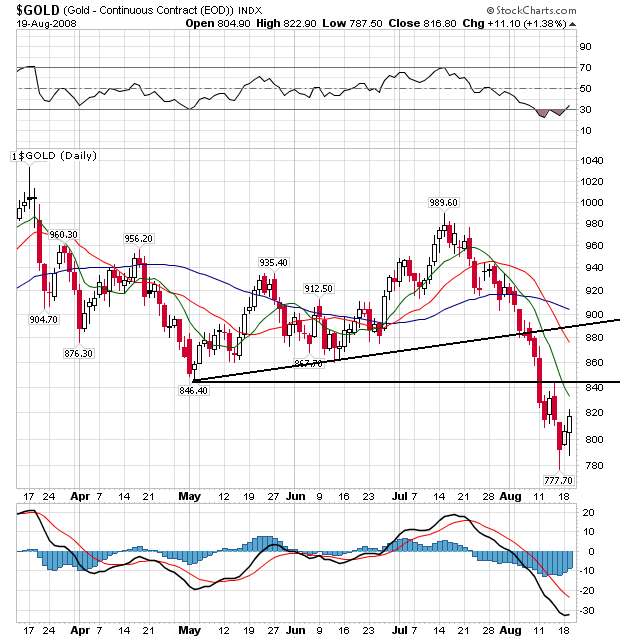
On the daily chart, notice the following:
-- Prices are below all the SMAs
-- All the SMAs are headed lower
-- The shorter SMAs are below the longer SMAs
-- Prices have broken two trend lines. The first is the upward sloping trend line that started at the beginning of May and the second is the low point from early May.
Bottom line: this is a chart that has changed directions, indicating inflation expectations are dropping.