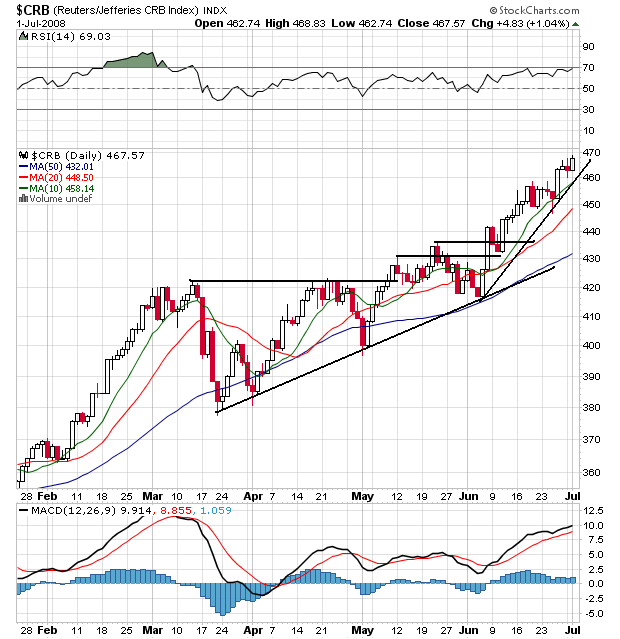
On the overall CRB chart, notice the following:
-- Prices are above all the SMAs
-- Prices have broken resistance levels and continued to move higher
-- All the SMAs are rising
-- The shorter SMAs are above the longer SMAs
Short version: this is a very bullish chart
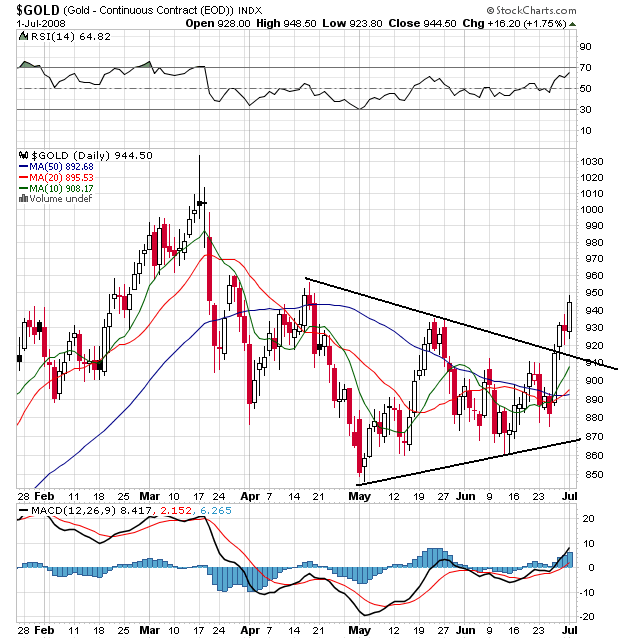
I use Gold as a proxy for inflation expectations. What's interesting about this chart is Gold has now broken out of a triangle consolidation pattern and is moving higher. Also note the 10 and 20 day SMA have turned up and moved through the 50 day SMA. This is still an early and developing situation so it could reverse pretty quickly, but it could also be the beginning of a new bull run in gold.
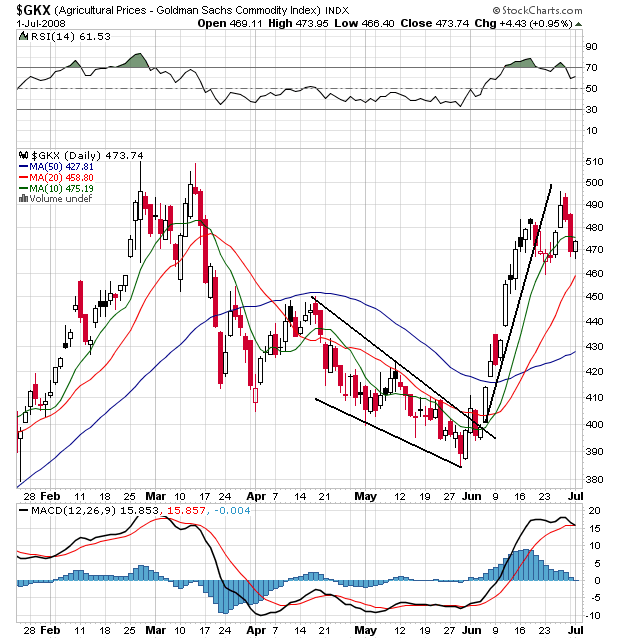
Agricultural prices have spiked since the beginning of June in reaction to the situation in the US Midwest. However, also notice the chart could be forming a double top. Peak prices from the June rally are very close to the peak prices of the rally that ended in early March. As with Gold's situation, we'll have to keep an eye on this chart to see how it plays out.