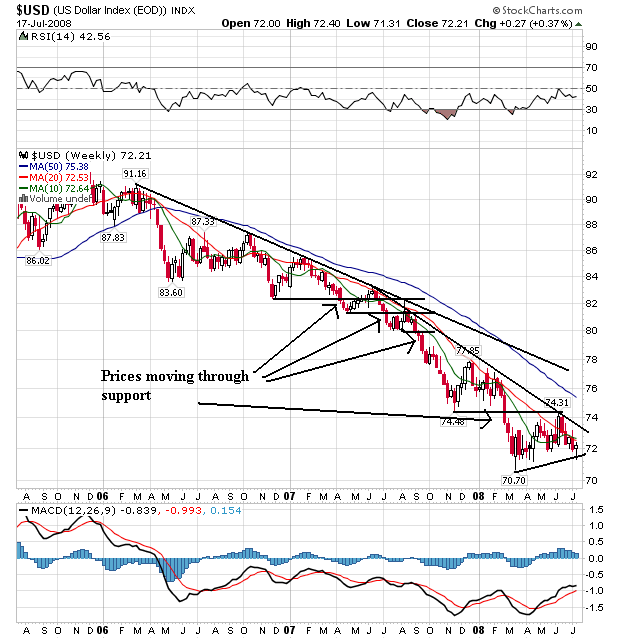
The dollar has been dropping for the last few years, continually moving through support and hitting new lows on a regular basis. All the SMAs are moving lower, All the shorter SMAs are below the longer SMAs and the prices are below the SMAs. Bottom line this is a bearish chart, plain and simple.
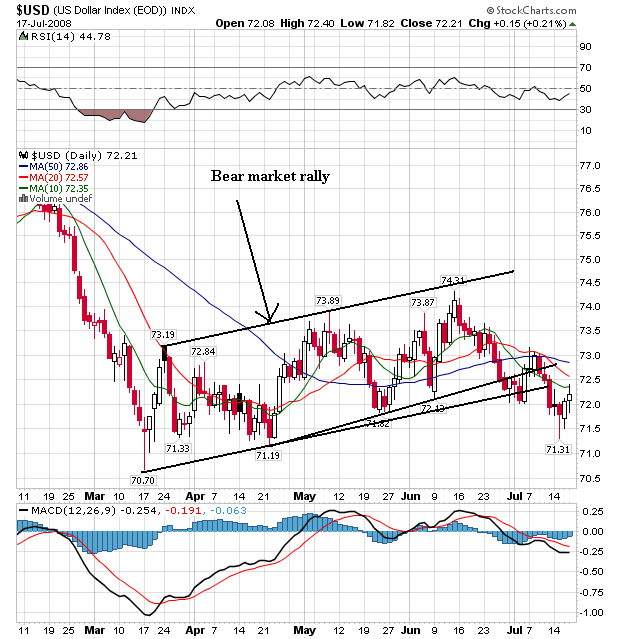
On the daily chart, notice prices rallied over the last three months but have now fallen through support. Also note the following:
-- Prices are below all the SMAs
-- All the SMAs are moving lower
-- The shorter SMAs are below the longer SMAs
In other words, prices and SMAs are now bearishly aligned.