First the good news:
The cause for optimism: the U.S. has called in the economic cavalry, which has responded in textbook fashion. The Federal Reserve has aggressively cut interest rates, bringing the Federal Funds rate down from 5.25 percent last September to 2 percent. Earlier this spring, Congress and President Bush, in a rare moment of bipartisan accord, passed a stimulus package, which will shove nearly $100 billion into the pockets of American consumers by mid-July.
Both of these events are net positives for the economy. For the next few months, the stimulus checks are going out. They are already responsible for the increase in Wal-Mart's recent sales report. In addition, cheaper money is usually a good way to get the economy moving.
But here's the bad:
But this downturn is likely to last longer than the eight-month-long recession of 2001. While the U.S. financial system processes popped stock bubbles quickly, it has always taken longer to hack through the overhang of bad debt. The head winds that drove the economy into this dead calm— a housing and credit crisis, and rising energy and food prices—have strengthened rather than let up in recent months. To aggravate matters, the twin crises that dominate the financial news—a credit crunch and the global commodity boom—are blunting the stimulus efforts. As a result, the consumer-driven economy may not bounce back as rapidly as it did in the fraught months after 9/11.
Let's take these one at a time.
it has always taken longer to hack through the overhang of bad debt
There is a ton of debt in the system which will blunt the effects of lower interest rates. I wrote this last week:
Total debt outstanding -- that is personal, corporate and government debt outstanding -- is $31.758 trillion. Total US GDP is $14.196 trillion. That means that there is 2.23 times the amount of debt in the US relative to the total value of the US economy.
Total household debt is $13.960 trillion. That means total household debt as a percentage of GDP is 98.33%. Disposable income at the national level is $10.502 trillion. That means that total household debt is 132.92% of disposable income at the national level.
Simply put, the US is literally drowning in debt. And it's going to take awhile to pay this debt off.
The head winds that drove the economy into this dead calm— a housing and credit crisis, and rising energy and food prices—have strengthened rather than let up in recent months
The housing crisis shows no signs of abating. The ultimate sign of problems is the massive drop in price:
May 27 (Bloomberg) -- Home prices in 20 U.S. metropolitan areas fell in March by the most in at least seven years, pointing to weakness in the housing market that will constrain economic growth.
The S&P/Case-Shiller home-price index dropped 14.4 percent from a year earlier, more than forecast and the most since the figures were first published in 2001. The gauge has fallen every month since January 2007.
Prices continue to slide as record foreclosures put more homes on the market and stricter lending standards make it harder to get loans. Falling home values are slowing consumer spending, threatening to halt the six-year expansion.
``There is excess supply, weakening demand, prices are falling and will continue to fall,'' said Kevin Logan, senior market economist at Dresdner Kleinwort in New York. ``Housing sales are still trending lower.''
When prices drop that much, you've got a problem.
We're still getting mixes news on the credit crisis front. Libor is still higher than the Federal Funds rate, indicating banks are still reluctant to lend to one another. In addition, the TED spread is still high, although it has come in a bit:
While some analysts have said the crisis is over (or has at least turned the corner) there are still sign of problems. For example:
Lehman unloaded at least $120 billion of holdings in the second quarter, said people with direct knowledge of the matter. At least $18 billion of the assets were tied to mortgages and leveraged-buyout loans that plummeted in value, said one of the people, who declined to be identified because the figures haven't been disclosed.
``They're doing all the right things, such as de-leveraging aggressively, but these are stressful times, and they don't always get the credit they deserve,'' said UBS AG analyst Glenn Schorr, who has a ``neutral'' rating on Lehman. ``Although Lehman is very different than Bear, there's one similarity, and that's what could undo all the other positives: perceptions can become reality.''
As a result of events like this, some analysts see problems for the foreseeable future:
Fund manager BlackRock expects the global credit crisis to last another two to four years as a weakening U.S. economy triggers more writedowns by banks, its chief investment officer for equities said on Monday.
"The credit crisis will be with us for a long time," said Bob Doll, CIO and also vice chairman of the U.S. money manager, which managed $1.36 trillion in assets at the end of March.
"The deleveraging of the financial system, which is the outgrowth of the credit crunch, will likely last a couple of more years -- two, three, four," he said.
Financial institutions around the globe such Citigroup and UBS have suffered more than $300 billion of write-downs and credit losses during a credit crisis triggered by the collapse of the U.S. subprime mortgage market.
And then there is oil. Here's the daily chart:
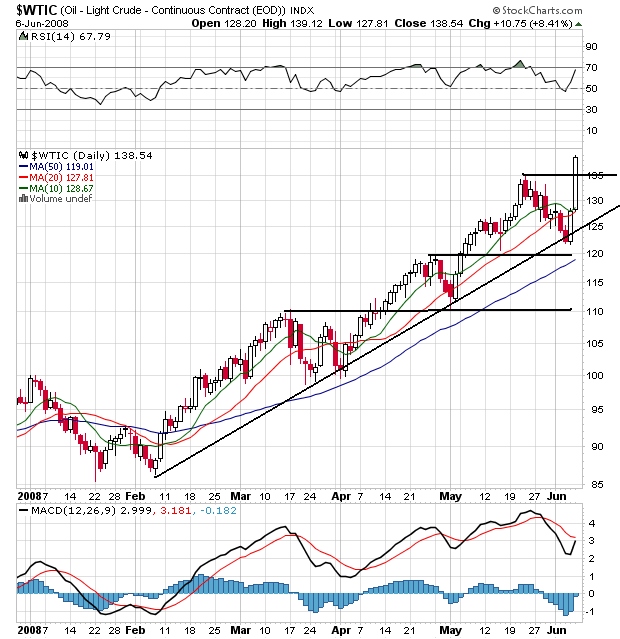
This is a bull market chart. Notice the following:
-- Prices are above all the SMA
-- All the SMAs are moving higher
-- The shorter SMAs are higher than the longer SMAs
-- Prices have continually moved through upside resistance
This is a bull market chart, plain and simple.
And here's a chart of gas prices from the latest This Week in Petroleum:
Not a pretty picture, is it?
And I'll add my own biggie: job growth stinks:
Bottom line -- it just doesn't look that promising right now.