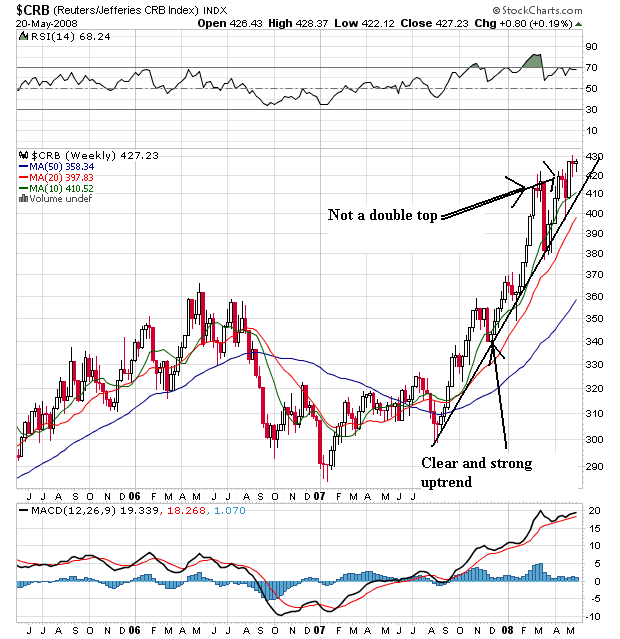
We'll start with the weekly CRB chart. Notice two points.
-- The sharp uptrend that started at the end of last summer is still in place.
-- The double top that appeared to be forming didn't.
However --
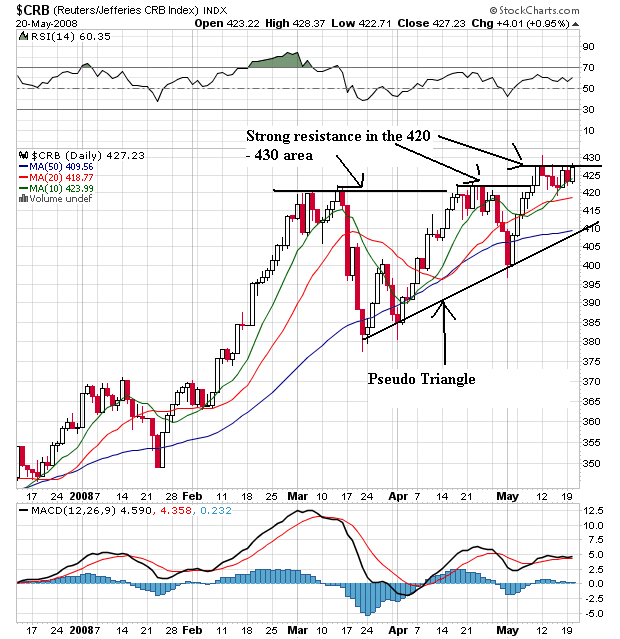
On the daily chart, notice that prices have a rising bottom (what I'm calling a pseudo triangle) but are having a hard time getting through the 420 - 430 area. That doesn't mean they won't get through this area, but they haven't yet. Also notice the following:
-- Prices have been using the 50 day SMA as support since January of this year.
-- Although the SMAs are technically in a good pattern (the smaller are above the larger), they're awfully bunched up with prices. That's not a good place for to be.
While there isn't a strong enough move in either direction to make a call as to where this chart is going, it sure looks like it is consolidating right now.
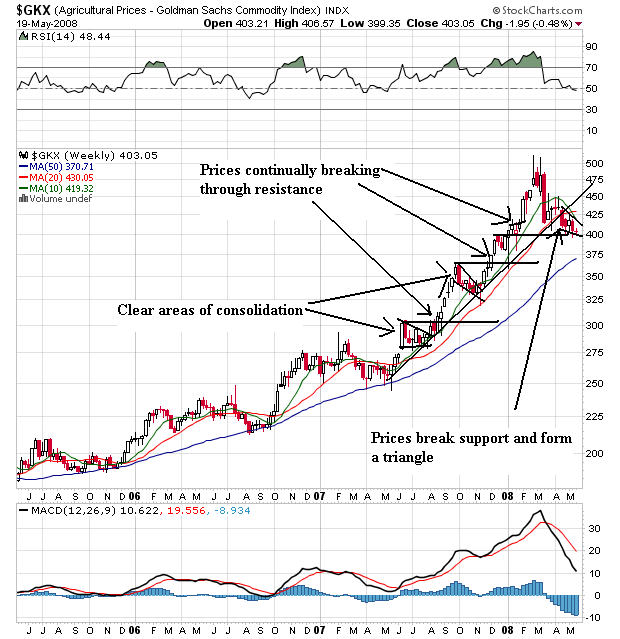
On the agricultural prices weekly chart, notice the following:
-- Prices were in a strong rally from the middle of 2Q07 to about the beginning of April. Prices continued to rise, hugged their trend line and consolidated gains along the way.
-- Prices broke that upward trend line at the beginning of April. Now prices have consolidated in a downward sloping pennant formation.
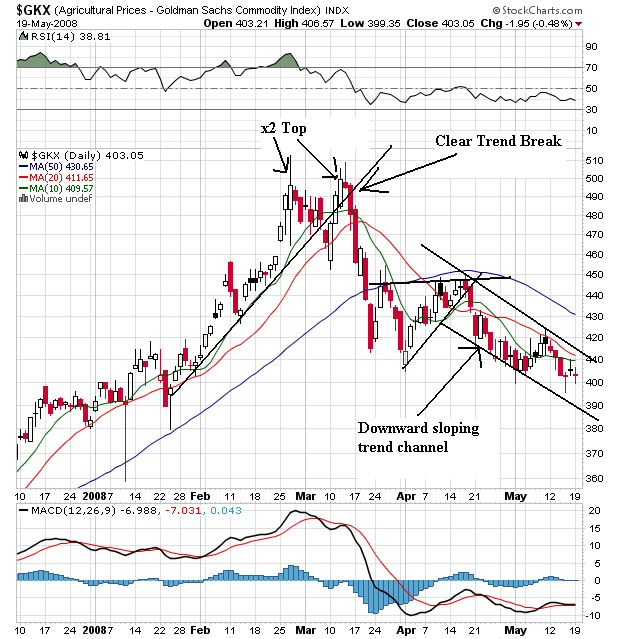
On the daily agricultural price chart, notice the following:
-- Prices rose from mid-January to early March.
-- Price formed a double top with the first top at the end of February and the second in mid-March.
-- Prices have dropped about 20% since then. They are currently in a clear downward sloping channel.
-- The shorter SMAs are below the longer SMAs
-- All the SMAs are pointing lower
-- Prices are below the SMAs
This chart says it's going to continue to move lower
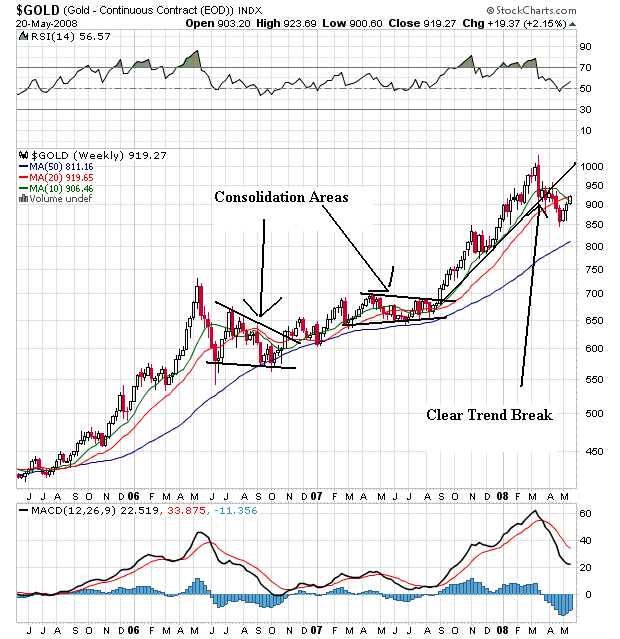
On gold's weekly chart, notice that prices have been rising for the better part of three years. They have risen and consolidated their gains along the way. However, the latest rally (which started at the end of last summer) is over as prices have broken through support.
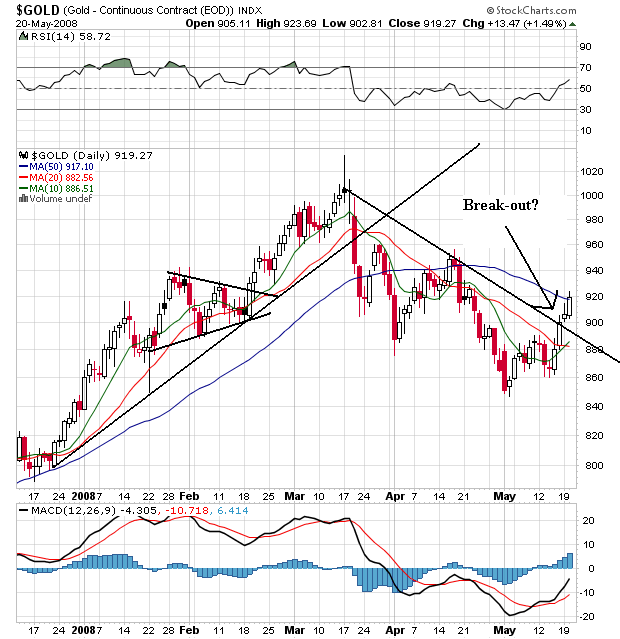
The daily chart shows a clear break occurred in mid-March. Prices have been dropping since then. However, prices may have broken through upside resistance. Notice the prices have moved through the 10 and 20 day SMA and are about to move through the 50 day SMA.
To sum up, it looks like commodity based price moves are taking an upside break -- at least for now. But there aren't firm downward moves yet. The CRB is still in an uptrend (although it is running into a great deal of upside resistance). While agricultural prices have clearly broken their uptrend, these prices have bounced off of the 50 week SMA on the weekly chart several times in the recent rally. And gold may have broken through upside resistance recently.
So, let's tie this into the latest inflation readings.
Year over year CPI has dropped a bit.
Year over year PPI is in a holding pattern
The good news is the year over year inflation numbers are at worst holding. But we're not out of the woods with these charts -- not by a long shot. For that to happen one of two things (or both) need to happen.
-- The CRB index breaks it's uptrend
-- Agricultural prices convincingly move through their 50 week SMA.