India's inflation accelerated at the fastest pace in more than three years in the week ended March 22. Philippine inflation quickened at the fastest pace in 20 months in March. Consumer prices gained 8.7 percent in February in China, an 11-year high. Food prices in the country, based on a government index, jumped 28 percent in February, the most since July.
The tug of war between commodities bulls and bears continues, with the bulls winning.
Thailand, the world's biggest rice exporter, pledged to maintain supplies and India vowed to crack down on hoarding as shortages drove prices to a record and threatened to trigger protests in Asia and Africa.
The nation ``has enough rice for export to neighboring countries'' and may be able to deliver as much as 1.2 million tons a month, Prasert Gosalvitra, head of the rice division of the farm ministry, said today in Bangkok. Thailand has shipped about 1.1 million tons a month since October, he said.
Rice, the staple food for about 3 billion people, gained 1 percent to its highest ever in Chicago today after doubling in the past year. Higher imports by the Philippines, the biggest buyer, and export cuts by China, India, Egypt and Vietnam pushed up prices, contributing to food riots in Ivory Coast and anti- hoarding campaigns in Pakistan and the Philippines.
``We expect a significant rise in prices, well above the long-term average, in the short-to-medium term,'' Les Gordon, president of the Rice Growers Association of Australia, said today. Population growth, urban encroachment on land, and rising grain prices are contributing to the increase.
Notice the use of the phrase "anti-hoarding campaign" and "food riots." We're no longer in a hypothetical "what if this happens" world. We're in a harsh reality that is impacting people's lives in a very negative way.
And here's a chart of rice
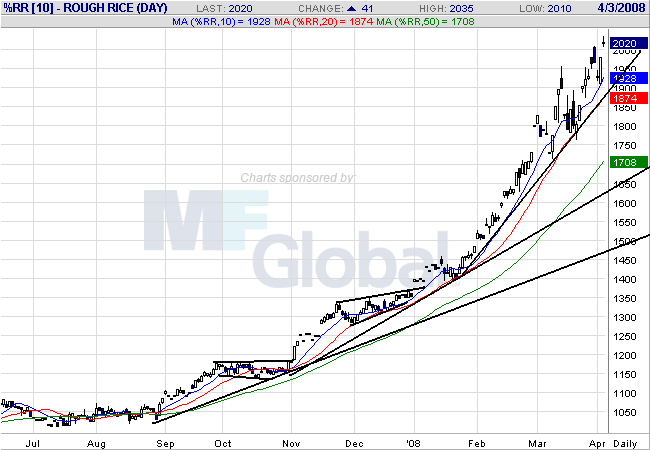
Notice the following:
-- All the simple moving averages are moving higher
-- The shorter SMAs are above the longer SMA
-- Prices are above all the SMA
-- Prices have continually consolidated and moved higher
-- Prices have continually broken through previous resistance
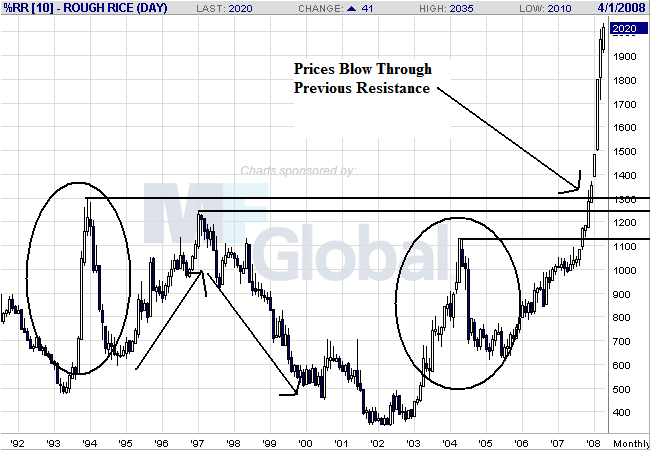
On the monthly chart, notice the following:
-- Prices are are all-time highs by a wide margin
-- Rice has had three other price spikes over the last 15 years, all of which were temporary
-- At the end of 1993 and at the beginning of 2004 there were large price spikes, followed by sell-offs. Both lasted about a year, with the 1993 spike having an equal amount of time of build-up and sell-off which the 2004 spike had a longer build-up and faster sell-off
-- There was a longer build-up from 1005-1997 followed by a gentler decline from 1997 - 1999.
The point of looking at the weekly chart is to demonstrate rice is a pretty volatile market that has been through ups and downs in the past 15 years. Rise is a staple of the Asian diet and the Asian region has grown over the last 15 years at strong rates. Putting these two facts together you get natural ebbs and flows in the price cycle.