From the really long-term perspective, we're coming down from a double top formation. The first top occurred at the end of the last bull market and the second top occurred in 2007. Remember, there is no firm rule as to how far prices may fall from a double top. In his book Encyclopedia of Chart Patterns Bulkowski offers the following advice about trading a double top pattern.
Compute the formation height by subtracting the lowest low from the highest high in the formation. Subtract the difference from the lowest low between the two tops. The minimum price movement results. Better performance occurs dividing the height in tow before subtracting from the confirmation point (page 210).
Just eyeballing the chart, we get 157 and 135, leaving a difference of 22. Halving that we get 11. 135 - 11 = 124. So, the market got to 126 -- two points above. In other words, we're a few points above a target point. Not bad.
Also consider the low from the sell-off is about where the 38.2% fib retracement is from the rally that started in early 2003.
On the five year chart, notice the market was in a rally from the beginning of 2004 until late 2006. At the end of 2006 the market broke through the upside resistance of the trend line. The market then formed a double top (which the arrow points out) in 2007 and fell through the upside trend lines from the 2004 rally. Now the market has rallied through the lower trend line.
On the year long chart, notice the market may have formed a bottom over the last three months. But also note the 139/140 area has provided a great deal of resistance for the SPYs. The latest move to that area is the third time the market has approached that area in the last three months. The market needs to move through this area and convincingly follow through in order to prove the current rally is for real.
Note that since early march, the market has been in a clear rally. Notice the following:
-- Prices are above all the short-term SMAs
-- The short-term SMAs (10, 20 and 50) are all moving higher.
-- The shorter SMAs are above the longer SMAs
This is a good chart. But, remember the comments from above about needing to break through the 139/140 area in a convincing manner for the rally to be considered real.
Let's look at the 10 day charts for each of the averages to see what they say
With the SPYs, notice the market rallied from 4/15 to 4/18 and then sold for a few days. Starting on Thursday of last week the market started to rally again and ended on a high note on Friday. As I have said before, the SPYs have to break through the 139/140 level.
The QQQQs have been is a solid rally for the last few months. Note the following from the QQQQ daily chart:
-- Prices are above the SMAs
-- The shorter SMAs are above the longer SMAs
-- All of the shorter SMAs are moving higher
The QQQQs have a very similar pattern to the SPYs. The main difference is the QQQQs have a shorter dip from the sell-off.
On the daily IWM chart, notice the index needs to break through the 72 area. This will make the latest rally meaningful and important. If they don't break through, then the rally of the last two months will be meaningless.
With the IWMs, notice the severity of the sell-off and the strength of the rally that started last Tuesday. The comeback last week is impressive, especially in light of the sell-off that occurred on Tuesday.
So -- why is the market rallying? The economy is not doing well. The economic numbers have been poor. The financial sector is still having writedown issues. This is not a good time to be looking at stocks, is it?
I think there are a few important points. First, Barron's made the following points over the weekend:
Much has changed since we took the pros' pulse last October, little for the better. Oil is up, profits are down, credit's constrained and a major brokerage is kaput. As for stocks, the Dow Jones Industrial Average peaked Oct. 9 at 14,164, only to plummet to 11,740 before regaining enough ground to land at 12,892.
As a result, our Big Money respondents say, bargains now abound. More than 55% of poll participants think the market is undervalued, while just 10% say it's overvalued. Eighty-seven percent expect to be net buyers in the next three to six months; only 13% intend to sell more shares than they buy.
"There's a lot of bad news already written in, and the market has improved because of it," says John Buckingham, chief investment officer at Al Frank Asset Management, in Laguna Beach, Calif., which manages $700 million. "If a company merely matches earnings expectations, its shares rally in this market."
I think the Fed's actions regarding Bear Stearns provided a catalyst for the current sentiment. The Fed basically said some firms are too large and/or important to fail. That means regardless of how bad the credit market gets the Fed will provide a backstop -- at least in the market's eyes. All this implies there is a floor to the market created by the Fed. that provides a lot of bullish sentiment.
Also, consider interest rates:
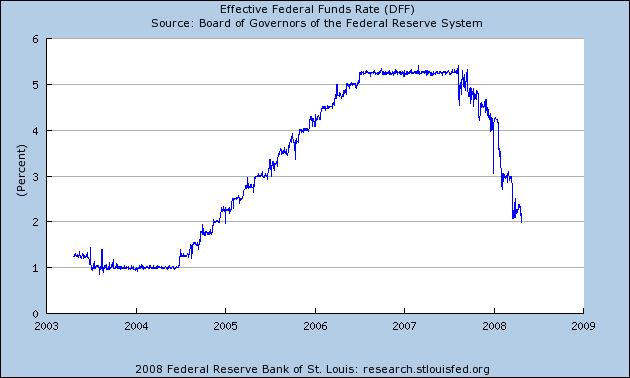
The Fed started cutting in the second half of 2007. Conventional economic thought says it takes 12-18 months for the full effect of interest rate cuts to move through the economy. That means the real full impact will be felt in the second half of this year. As a result, managers don't want to be left behind when the rally starts.
That doesn't mean an economic pick-up is a sure thing. Consider these observations (from the same Barron's article):
Valeiras' chief concern is the coming presidential election, and the confusing array of tax packages that candidates will offer up. "An uncertain tax and political environment could impact investor sentiment and therefore play a critical role," he said in written comments. "A housing slump, the current credit crisis and inflation should continue to suppress consumer spending, slowing economic growth in the U.S. Even without the financials, earnings this year could be weaker than analysts suspect."
These are all good points. Investors don't like uncertainty -- and this year's presidential race is creating a ton of it. And consumer sentiment is at 26 year lows, indicating the consumer (who is responsible for 70% of the economy) may not be ready to do his part by spending on all sorts of stuff. In other words, there are still a ton of wild cards out there.
So, before you get too excited, remember there are plenty of legitimate reasons to be concerned.