First, here is a graph from the blog Calculated Risk that shows residential and commercial construction spending.
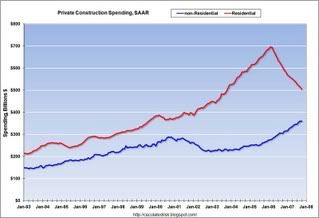
I had to decrease the chart's size to get it on the blog. The red line is residential and the blue line is commercial. The main point I want to get across is commercial construction has helped to pick-up some of the slack caused by the decline in residential construction. As a result, some of the industries below haven't tanked nearly as hard as one would believe given the plight of residential construction.
The charts are from prophet.net, which is a great site for industry graphs. I highly recommend it.
Now -- on to the graphs. All are 5 year graphs, which helps to see the general overall trend of these various sectors.
Lumber had a year long rally that started in July of last year. But the index formed a head and shoulders reversal pattern from the spring to the fall of 2007 and has since fallen through the neckline of the head and shoulders patter.
General Contractors have benefited from the increasing commercial construction; their chart remained strong for the last three years. But it appears the chart has formed a double top, indicating a trend reversal may be occurring. We'll need for the index to drop below the low point between the two tops at roughly 250 to confirm that a double top has formed.
Heavy construction has two uptrends; one that lasts 3.5 years and another that lasts about 4 and a half years. The index has already fallen through the 3.5 year uptrend and found resistance at its previous trend line. That indicates this sector has already experienced a strong sell-off that is related to the current housing market.
General building materials have already broken a 4.5 year uptrend. But we need a stronger confirmation of the trend break to be sure.
Cement has broken a four and a half year uptrend. It formed a head and shoulders reversal formation from early to late 2007 and fell through the neck line in late 2007.
All of these industries have already reversed or are set to reverse. In other words, these sectors look like great shorts right now.