Lennar's (LEN - Cramer's Take - Stockpickr) sale of a chunk of its land portfolio at a steep discount boosts liquidity for the homebuilder, but it also points to troubling signs about the stock's valuation.
The company sold its land to Morgan Stanley (MS - Cramer's Take - Stockpickr) at a 60% discount to book value. That raises the question: What if all of Lennar's land is worth 60% less than what is stated in the company's financials?
If that's the case, Lennar's stock is wildly overpriced.
The Morgan Stanley deal highlights how much land values are plummeting across the country. The discount falls within the range at which builders are shopping deals to real estate vulture funds, sources say.
Yes, you read that right. Lennar sold land on its books for a discount of 60%. Remember -- we're not talking about a product, or a cheap trinket. We're talking about land. Either Lennar was seriously overvaluing its land portfolio or land prices are plummeting.
Yesterday, homebuilders rose:
Investors bid up the value of housing stocks Monday as the U.S. Treasury secretary said a plan to aid strapped homeowners is close to being finished.
Henry Paulson said he is confident there will soon be an agreement to help thousands of homeowners avoid mortgage defaults by temporarily freezing interest rates. Some 2 million subprime mortgages, loans issued to people with spotty credit histories, are scheduled to reset to higher interest rates in 2008.
I have to wonder how long the relief jump will last. Housing is still a complete and total mess.
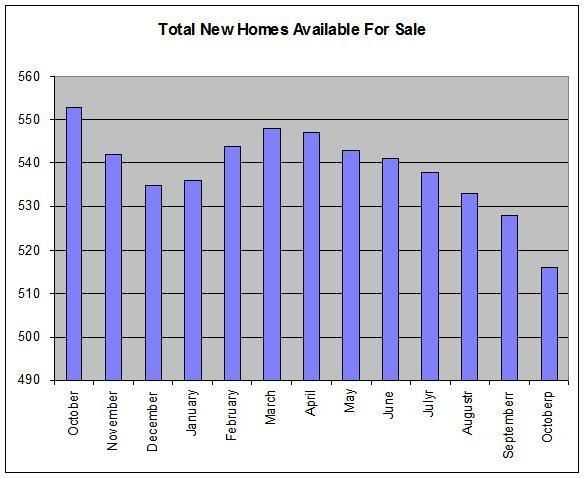
While the total inventory of new homes has come down:
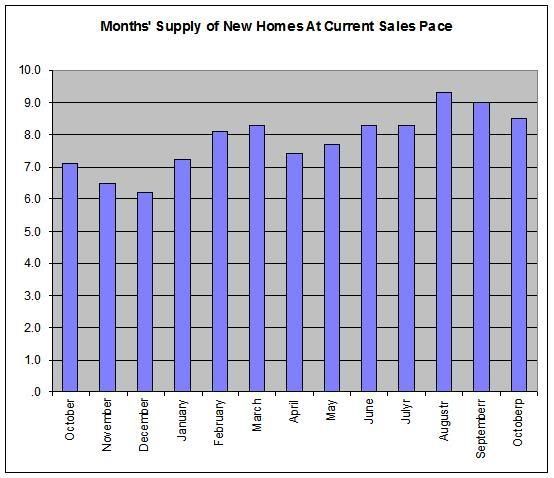
The months of supply at current sales rates is increasing, indicating demand is really tanking.
And the existing homes market -- which is much larger than the new homes market by a factor of 8.5 -- is experiencing the same problems.
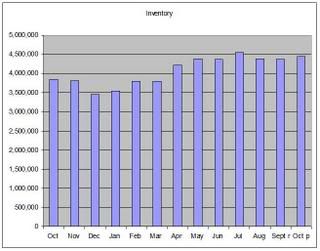
Total inventory of existing homes is high
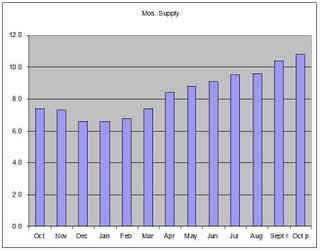
And the months of supply at current rates of existing homes is still increasing:
Here is a chart of the homebuilders ETF, the XHB.
This is an incredibly bearish chart.
1.) Prices are 34% below the 200 day SMA.
2.) All of the moving averages are headed lower.
3.) The shorter SMAs are below the SMAs.
The only good news in this chart is that prices have jumped over the 10 day SMA over the last two days.

The real estate ETF recently broke a 4-year uptrend. When the ETF tried to rally it ran into resistance at it's previous trend line.
There are a few ways to look at the current chart.
Some traders could see a double bottom. And technically (pun intended and accepted) they would be right. But this is a great example of why technical analysis without fundamental analysis is deeply flawed. As I mentioned above, the fundamental backdrop is terrible, making a rally based on fundamentals highly unlikely. As a result, I think the best way to look at this chart is a sell-off, followed by a rally, followed by a further sell-off.
A look at the moving average picture makes this analysis more likely:
1.) Prices are below the 200 day SMA.
2.) The shorted SMAs are below the longer SMAs.
3.) Prices are below the SMAs.
4.) All the moving averages are heading lower.
However, to confirm this isn't a double bottom, we'll need a price move below the previous lows of about 67 or so.
The Paulsen plan does place a strong wild card into this scenario. Traders are looking for any sign that Washington is doing something about housing. And the plan fills that void. However, the devil is in the details. We'll have to see how that plays out. In addition, it seems the plan would help the financing arm of the mortgage business rather than the builders.
But at the very least, the plan could stop the downward move for awhile while traders figure out if the plan is any good or not.