U.S. benchmark crude dropped sharply yesterday, falling $3.28 a barrel, or 3.4%, to $94.42 in futures trading on the New York Mercantile Exchange. But analysts stopped short of calling the shift a correction. The market remains unusually volatile and could easily shoot upward again -- even breaking the $100 mark -- if the Organization of Petroleum Exporting Countries doesn't follow through on talk of a production increase or if Western stockpiles dip unexpectedly. Oil prices hit an intraday record of $99.29 a barrel last week. Oil reached its inflation-adjusted high of $102 a barrel in April 1980.
.....
Topping the list is the sluggish U.S. economy, which some economists say is heading toward a recession as the meltdown of the U.S. subprime-mortgage market crimps lending. That would damp oil demand in the U.S., the world's largest oil consumer. It could also prompt a slowdown in other economies, including in China, now the fastest-growing consumer of oil.
Signs have also emerged of increased crude supplies from the Middle East as OPEC lives up to an agreement in September to raise output by 500,000 barrels a day as of the beginning of this month.
A big factor driving down prices yesterday was mounting expectations that OPEC ministers will move to increase output by an additional 500,000 barrels a day when the group meets in the United Arab Emirates next week. The oil cartel satisfies about 40% of world demand, which hovers around 85 million barrels a day.
Let's review just a bit. One of the main drivers of oil prices over the last few months was the situation on the Turkey/Iraq border. That really spooked the markets. If Turkey invades northern Iraq part of the Iraqi pipeline system will be endangered. I haven't seen anything on this situation for awhile.
However, there is also the issue of decreasing US stockpiles. Here is the chart of US stockpiles from This Week in Petroleum:
Notice US stockpiles have been decreasing since the summer. Econ 101: decreasing supply = increasing price.
So we have a few solid reasons for oil's increase -- geopolitical risk and supplies.
However, no index moves up indefinitely. And an increase in OPEC supplies may be enough to send oil prices lower -- at least for now. Time that with the end of the year and the fact that traders may be looking to take at least some of their profits and we have the possibility for a market reversal.
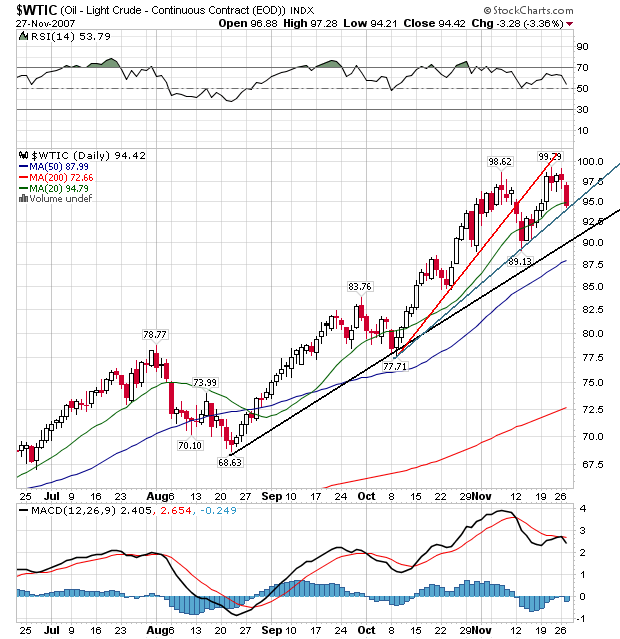
Above is a chart of oil. Notice the following.
On the Bullish Side:
1.) The primary uptrend which started in mid-August is still intact. Prices would have to move through the lower 90s to break this trend.
2.) The simple moving average (SMA) picture is still very bullish. Prices are above the 200 day SMA. The shorter SMAs are above the longer SMAs.
3.) Yesterday prices broke the 20 day SMA, but they did this before a few weeks ago.
However,
4.) There is a minor uptrend (with the red line) that started in early October. Oil already broke this trend. This support line became resistance during the latest price moves.
5.) There is a second minor uptrend in place (in green) that oil is getting ready to break.
6.) Oil may have formed a double top in November.
One of the main issues I see with this chart is the double top. That is a classic reversal formation and whenever I see it I think "reversal".
However, we're talking about oil which is an incredibly fickle and difficult market to trade. So beware.