Here is the territory I'm going to cover.
1.) A long-term view of the markets (4-5 years). There are bullish and bearish implications to consider.
2.) An intermediate view of the marker (1 year).
3.) A look at the Russell 2000 and Transportation averages.
4.) A look at market breadth.
5.) A flight to safety in the form of a bond market rally.
A long-term view of the markets (4-5 years).
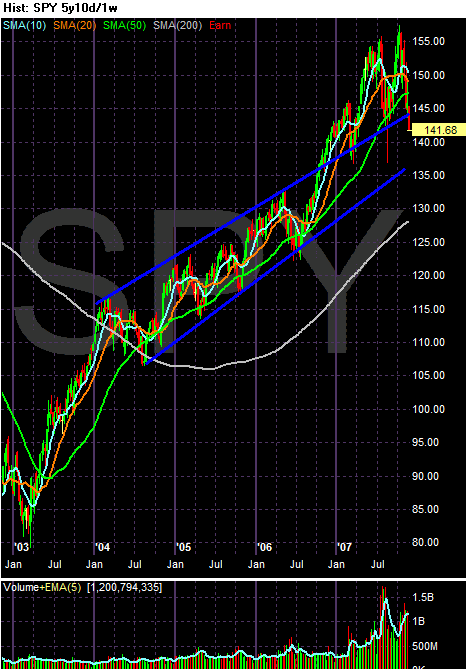
This is a 5-year chart of the SPYs broken down into weekly movements. Notice the upward sloping channel that started in early 2004. The SPYs broke out of this channel in late 2006 and have since used the upper band of the channel as support. Currently, the index has broken through this support and is heading for the lower trend channel.
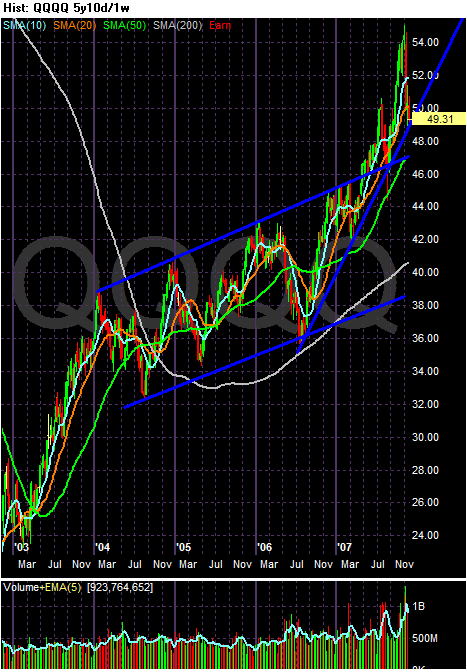
This is a 5-year chart of the QQQQs broken down into weekly movements. Notice there are two trends in place. The first is an upward sloping trading channel that started at the beginning of 2004. The second is an upward sloping rally that started in mid-2006. Currently, the QQQQs are approaching the trend line that started in mid-2006.
Let's stop here and make an important observation: The SPYs and QQQQs still have strong support for their uptrend. The QQQQs have three supporting trend lines -- the one that started in mid-2006 and the upper and lower bands of the upward sloping channel that started in 2004. The SPYs still have the lower trend line of the upward sloping channel that started in early 2004. In other words, these indexes still are in decent technical shape.
However, notice that on both the QQQQs and SPY charts above the last part of each rally is characterized by heavy volume. This may be a selling climax:
....For a buying climax, the opposite occurs, and the market begins to sell, resulting in lower prices. The climax is merely the highest point of selling or buying and can be followed by many trend reversals.
Also consider this passage from Gartley's Profits in the Stock Market (page 219:
There appears to be no exact counterpart of the selling climax, on the mull side of the market. At least, the past 40 teals' history does not seem to show any tops, either mayort or intermediate, which compare closely to the selling climaxes in either bull or bear markets. This is true, at least, of the price trend. If we want to consider activity, it is, of course, a fact that many bull market tops are accompanied by what might be called buying climax volume.
The heavy volume could be a buying climax.
An intermediate view of the marker (1 year)
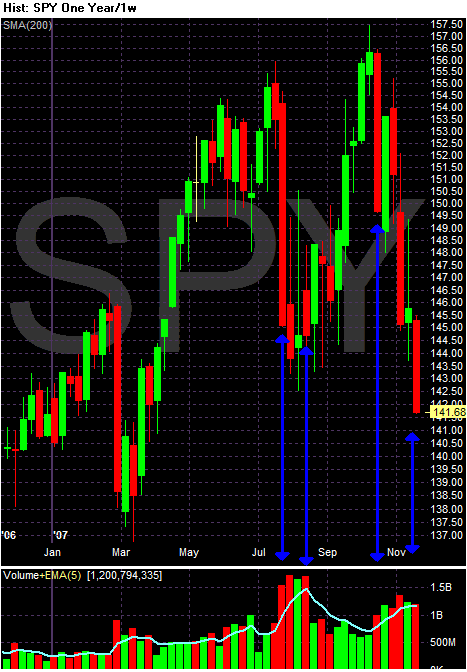
This is a one year chart of the SPYs in weekly candles. Notice the two areas marked by arrows. These are heavy selling areas where the market sold off hard on heavy volume. Notice the selling volume is noticeably higher than the preceding buying volume. This indicates traders have had a hair trigger for some time -- when it looks like it's time to take a profit, a ton of traders take a profit. This indicates traders don't have a lot of confidence in the strength of the rally.
Also note the SPYs may have formed a double top -- a reversal formation.
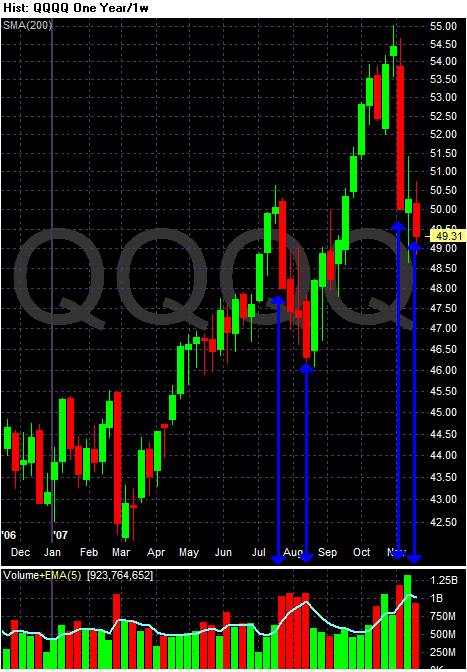
This is a one year chart of the QQQQs in weekly candles. Notice the two areas market by arrows. These are heavy selling areas where the market sold off hard on heavy volume. Notice the selling volume is noticeably higher than the preceding buying volume. This indicates traders have had a hair trigger for some time -- when it looks like it's time to take a profit, a ton of traders take a profit. This indicates traders don't have a lot of confidence in the strength of the rally.
So, to sum up so far:
1.) The long term trends for the SPY and QQQQ are still intact. But,
2.) We may have seen a selling climax over the last year, and
3.) We've seen traders develop a hair trigger in regards to the market; traders are selling quickly and in higher volume than the rallies.
A look at the Russell 2000 and Transportation averages.
Now, let's look at the markets that are causing concern.
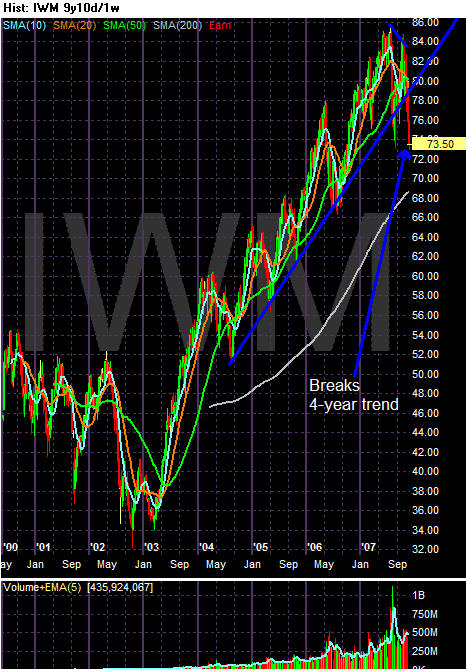
This is a four year chart of the IWMs or Russell 2000. This index has already broken a 4-year uptrend. Let's make an assumption that the Russell 2000 is a proxy for risk appetite. If that is a correct assumption, then this trend break indicates the market's risk appetite is decreasing.
Let's add a complicating factor to this analysis. According to Investorpedia, a bear market is:
A market condition in which the prices of securities are falling or are expected to fall. Although figures can vary, a downturn of 15-20% or more in multiple indexes (Dow or S&P 500) is considered an entry into a bear market.
Eyeballing the IWMs, notice the high of about 86 and a current level of 73.00. That's a decrease of 14.53%, or pretty close to the definition of a bear market.
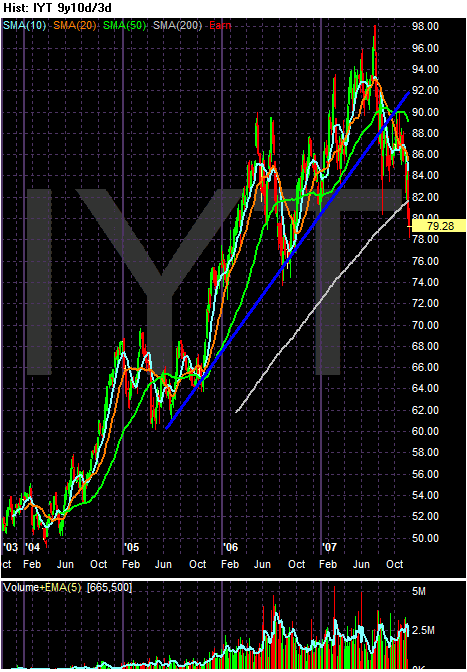
This is a weekly chart of the Transportation index in weekly bars. Notice this index has broken a 2 year uptrend. Remember this chart for the next chart.
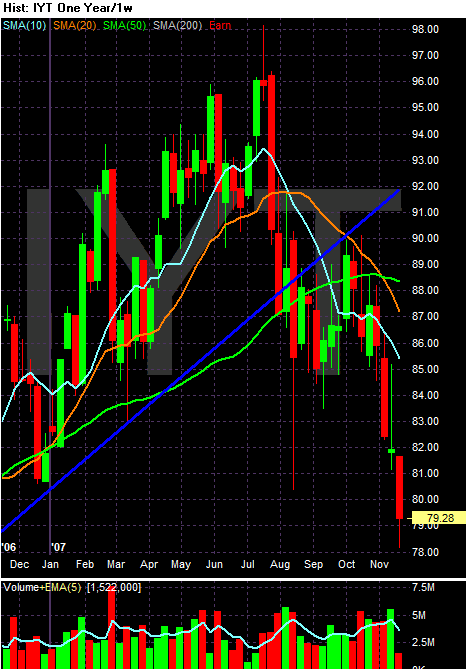
This is a one year chart of the transportation index in weekly bars. The high is about 96 and the current price is 79.28. That's a drop of 17.41%, clearly within the bear market definition.
OK, let's sum up what we've covered so far. The QQQQs and SPYs are still in a ling-term uptrend. The QQQQs have three levels of technical support and the SPYs have one level of technical support. In other words, these indexes are in decent shape. But, the Russell 2000 has broken a four year uptrend and has dropped a little under 15% since its high. And the Transportations index -- which Dow Theory says must confirm a an upward movement in stock prices -- has broken a two year uptrend and has fallen 17.41% since its high. That means there are two markets -- the Russell 2000 and the Transportation index -- which are either very close to bear market territory or in bear market territory.
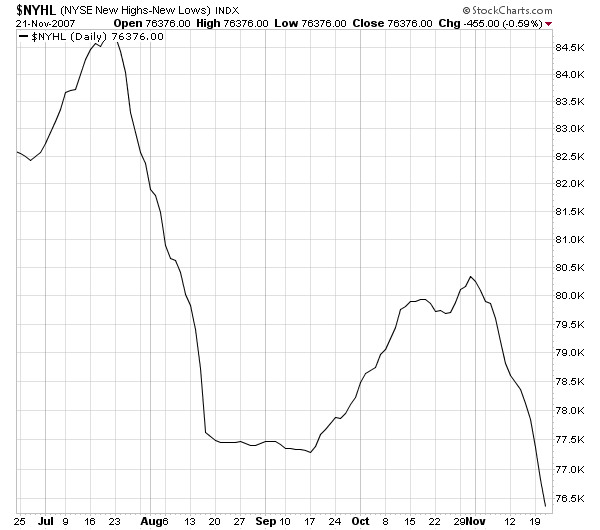
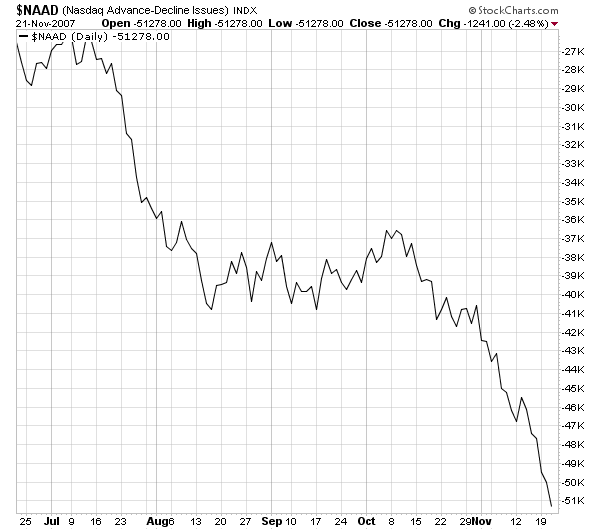
A look at market breadth.
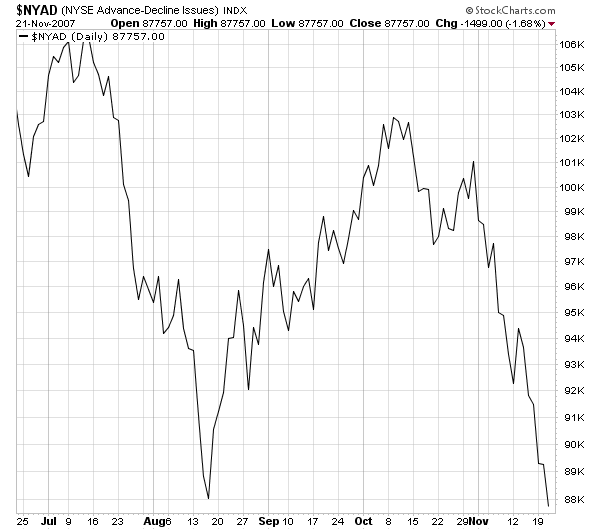
Market breadth has been declining for the last month.
NYSE advance/decline:
NYSE new highs/new lows
NASDAQ advance/decline
NASDAQ new highs/new lows
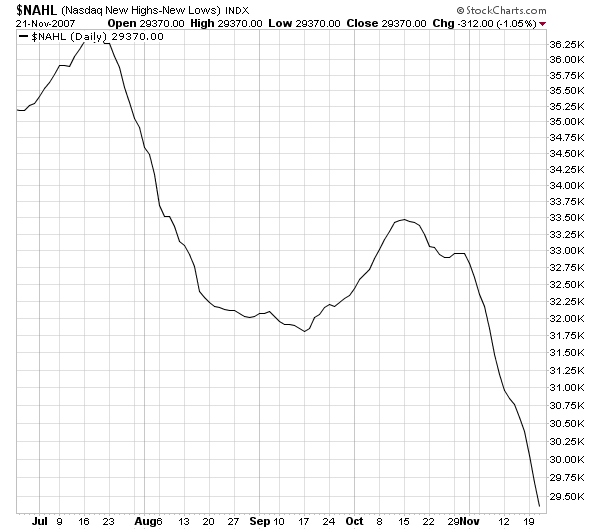
Regarding the NASDAQ, remember this market was the darling of the street over the last few months. Technology -- which had no exposure to real estate or the mortgage market -- was going to save the market. From mid August to the end of October the QQQQs increased about 18%. However, during this time note that NASDAQ market breadth was neutral for most of this rally, indicating that a few amount of issues were responsible for the rally.
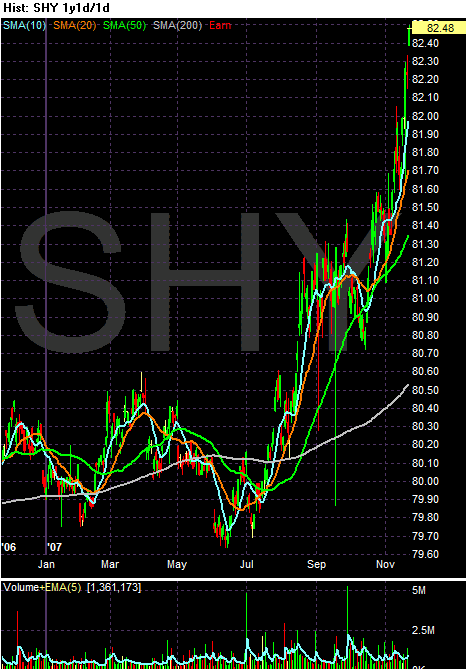
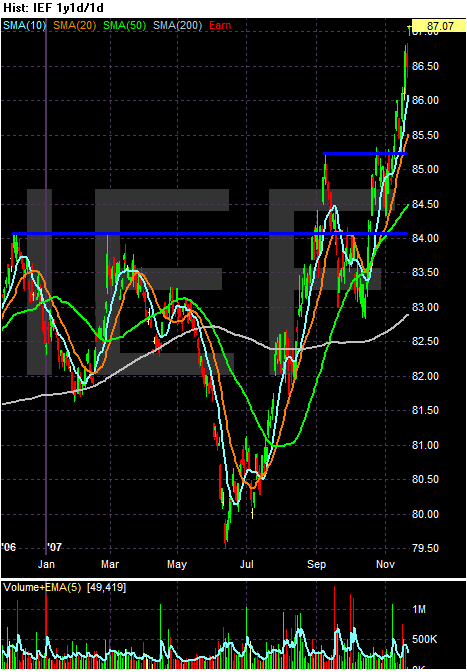
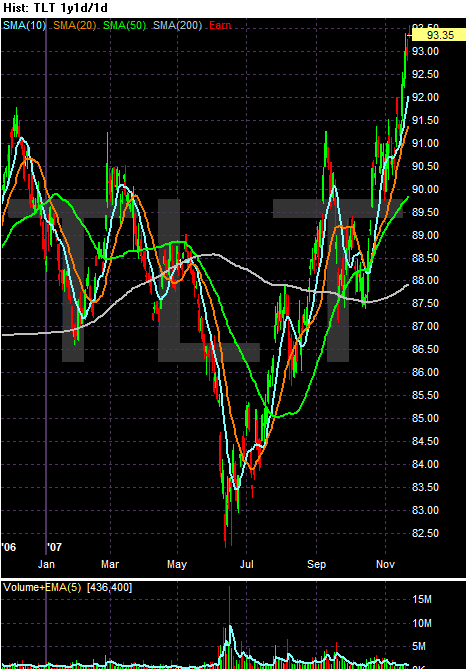
A flight to safety in the form of a bond market rally.
Since the first sell-off in mid-July, the bond market has rallied. Treasury bonds are considered the safest investments around. One of the reasons investors move into Treasuries is they are concerned about the markets and are looking to park their money is safe investments to wait out the turmoil. Now -- it's also important to point out that another reason for the bond market rally could be the Fed cutting interest rates. A cut in interest rates makes debt issued before the rate cut more valuable. But while we have had rate cuts, we've also had a lot of bad economic news come out -- massive writedowns, declining consumer confidence and high gas prices (just to name a few). This is the type of news that concerns investors and pushes them into the safety of the Treasury market.
Here are the charts for the 1-3 year Treasury ETF, the 7-10 year Treasury ETf and the 20+ year Treasury ETF. Notice they have all rallied since July.
So -- let's sum everything up.
1.) The multi-year charts indicate the rally is still on, although the high volume over the last year may indicate we have seen a selling climax.
2.) The year chart shows traders have a hair trigger, and will sell on high volume.
3.) The Russell 2000 has broken a 4 year uptrend and is nearing a bear market sell-off point.
4.) The Transports are in bear market territory, preventing a Dow theory confirmation.
5.) Market breadth has been declining, especially on the NASDAQ during its latest rally.
6.) Investors are moving into Treasury debt, indicating a flight to safety may be going on.
This market has some serious chinks in its armor. The Russell 2000 and Transportation average are cause for serious concern. So is the lack of market breadth during the NASDAQ's latest rally and the Treasury market rally. If only one of the preceding facts was occurring we could dismiss it. However, with all four occurring at the same time, it's important to take a close look at the market to see if a rally can continue.