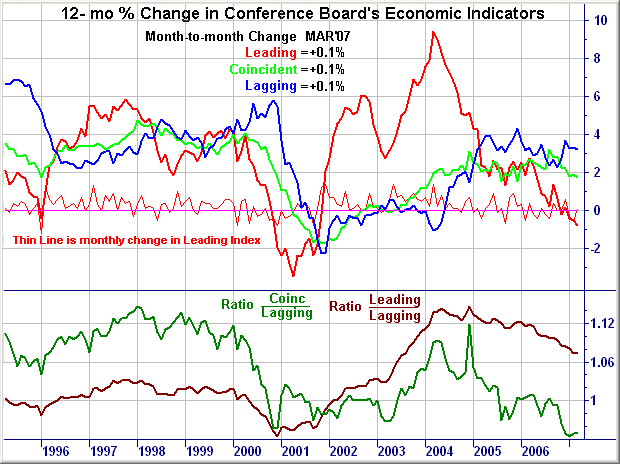
* The leading index decreased in April, and the small March increase was revised up as actual data for manufacturing new orders for nondefense capital goods became available. The leading index declined or remained the same in three of the last six months. As a result, from October to April, the leading index fell 0.2 percent (a -0.4 percent annual rate). In April, housing permits made the largest negative contribution, but the weaknesses among the leading indicators have been somewhat more widespread than the strengths over the past few months.
* The coincident index increased again in April, the third consecutive gain. From October to April, the coincident index rose by 0.7 percent (a 1.3 percent annual rate). In April, all four coincident indicators contributed to the gain and the largest contribution came from industrial production followed by personal income. The coincident index grew at an average annual rate of about 2.5 percent in 2006, but its growth has moderated to about a 1.5 to 2.0 percent average annual rate in the first four months of the year.
* The leading index is 0.7 percent below its April 2006 level. In the second half of 2006, the leading index was essentially flat from July through November, followed by a small pick up in December, and it is now slightly below its October level. At the same time, real GDP grew only at a 1.3 percent annual rate (advance estimates) in the first quarter of 2007, following a 2.5 percent rate in the fourth quarter of 2006. The recent behavior of the composite indexes suggests that economic growth is likely to continue to be slow in the near term.
....
The leading index now stands at 137.3 (1996=100). Based on revised data, this index increased 0.6 percent in March and decreased 0.6 percent in February. During the six-month span through April, the leading index decreased 0.2 percent, with three out of ten components advancing (diffusion index, six-month span equals thirty percent.)
I made it a habit of not looking at leading/sentiment indicators because I didn't think they were very good at predicting. However, some research from Merrill Lynch (I'm a client) proved me wrong. The LEI index is actually pretty good at forecasting the next 3-6 months.
Here's a chart from Martin Capital that shows the Leading, Coincident and Lagging indicators from the Conference Board:
