Here's the Russell 2000
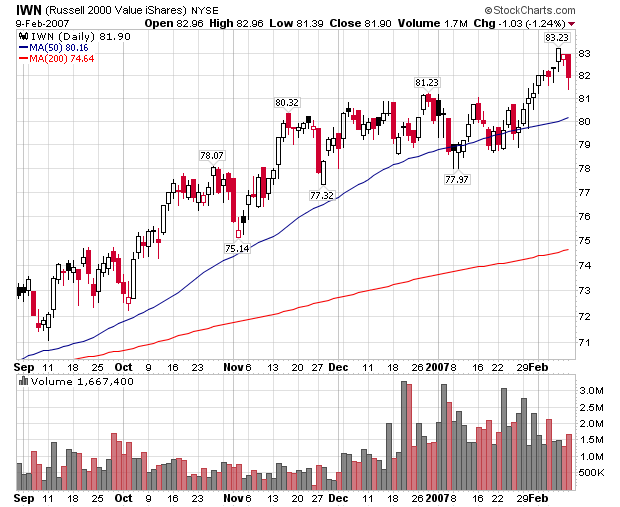
This index broke out of a trading range last week and continued moving up until Friday. The index rose 2.46% above the early December high before Friday's sell-off. The latter part of the rally lacked a strong amount of volume, making that move a bit suspect. However, sell-offs in rallies aren't necessarily a bad thing as they clear out some dead-weight. If this index reaches support at 81.23 and bounces off the index will be in good shape for another move up.
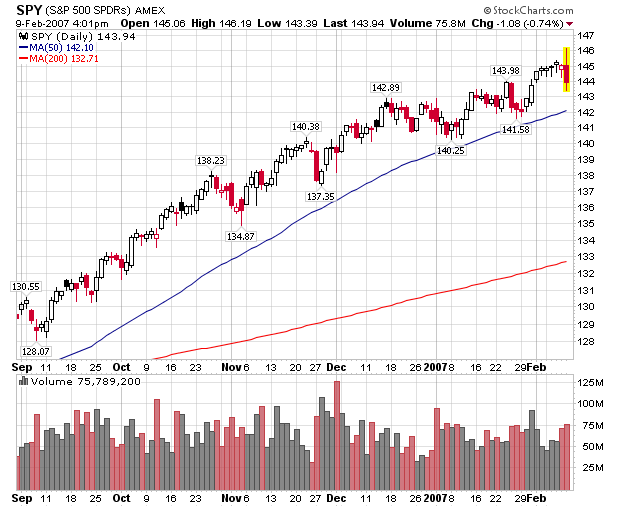
The SPY's rally for the week of 29 January to 2 February was suspect because of the declining volume of the move up. The market had four spinning top candle's before Friday's sell-off. There was ample news to move the market higher -- solid earnings and strong GDP. However, there just isn't enough buying enthusiasm right now. As a result the market was ripe for a pull-back. The higher volume total on Friday indicates selling pressure is very much alive in the markets.
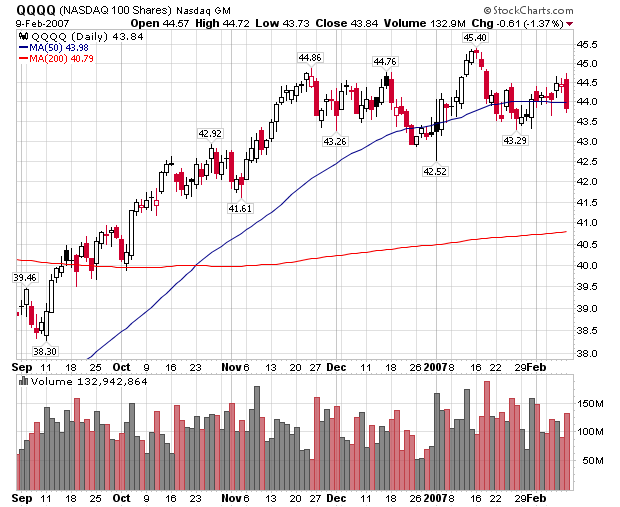
The QQQQs tried to continue the rally of 28 January - 2 February, but just didn't have enough buying interest. The index has been trading in a loosely defined range of roughly 43-45 with one run above and below that number. Trading ranges indicate supply and demand are in balance as traders are unwilling to commit one way or the other.